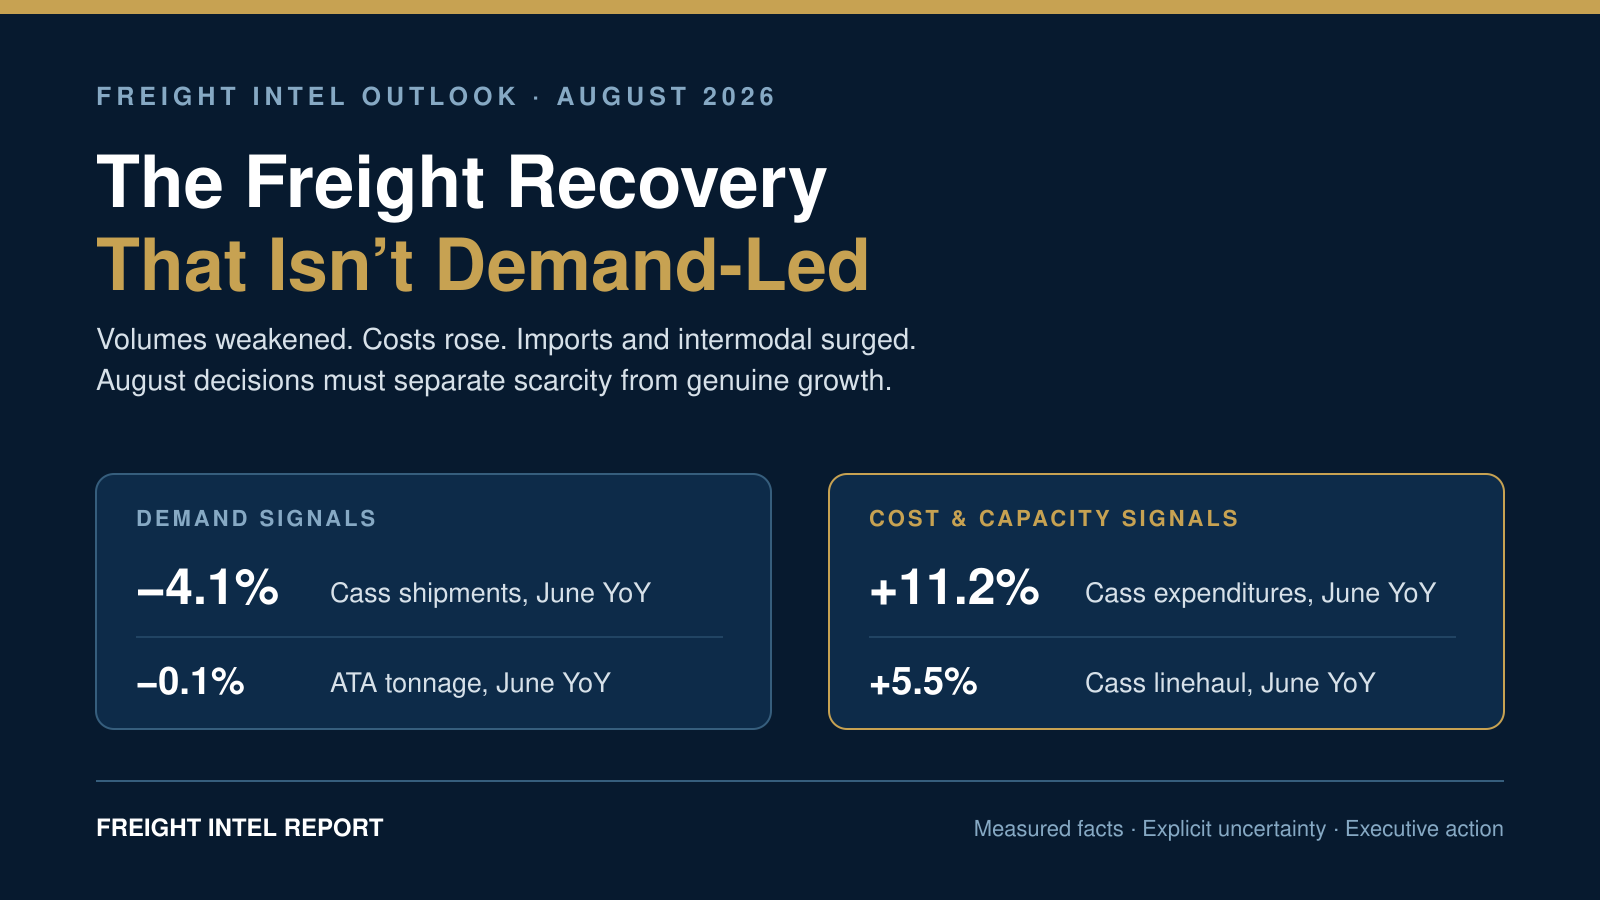
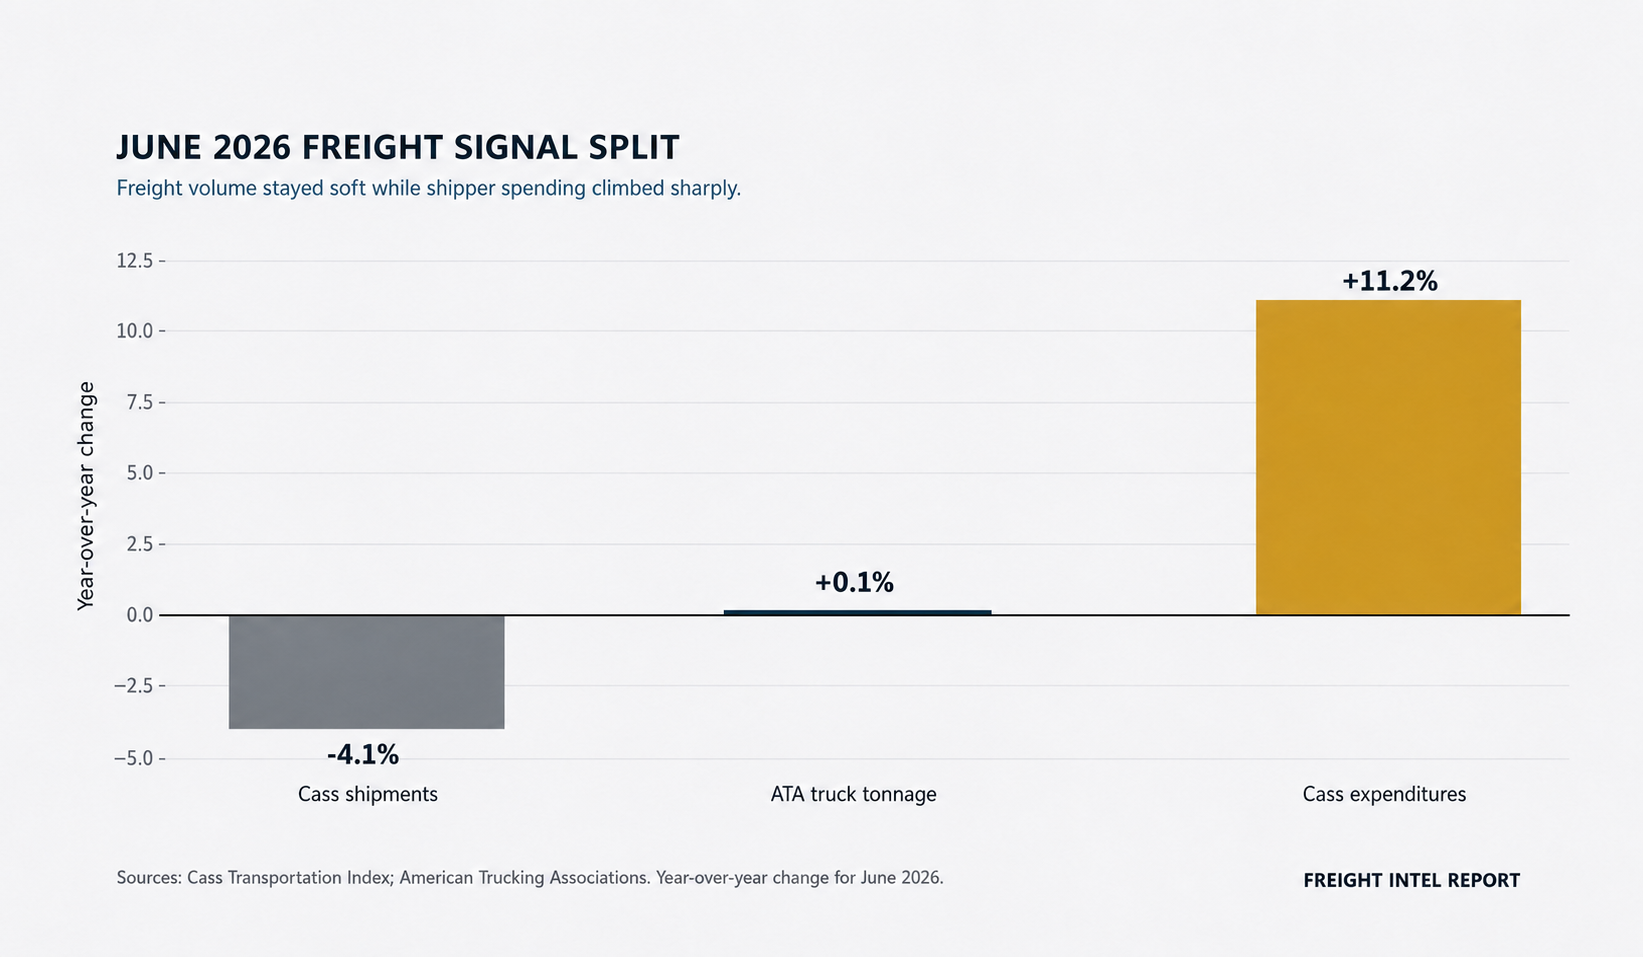
June’s freight data delivered a message that transportation leaders cannot afford to flatten into a simple “recovery” or “recession” narrative: shipment demand remained soft, but the cost of moving freight continued to rise.
The Cass Freight Index showed shipments falling 4.1% year over year in June and 3.1% from May. On a seasonally adjusted basis, shipments declined 2.9% month over month, reversing much of the progress made earlier in the year. At the same time, Cass freight expenditures climbed 11.2% year over year and 2.2% from May. Its Truckload Linehaul Index was up 5.5% from a year earlier even after slipping 0.9% during the month.
The American Trucking Associations added another piece to the picture. Its seasonally adjusted For-Hire Truck Tonnage Index rose only 0.1% in June. Truck tonnage was essentially flat, not surging. Meanwhile, seasonally adjusted truck-transportation employment declined from 1.4679 million jobs in May to 1.4666 million in June, according to Bureau of Labor Statistics data published by the Federal Reserve Bank of St. Louis.
The conclusion is not that demand has fully recovered. It has not. The stronger signal is that available capacity and operating economics are changing faster than freight volumes.
A SUPPLY-LED RATE RECOVERY
In a classic demand-led freight recovery, shipment volumes strengthen first, trucks become harder to secure, and rates follow. The present cycle is behaving differently. Cass characterized the June market as a supply-led rate recovery: capacity has contracted enough that rates are strengthening even though shipment demand remains uneven.
Years of weak pricing forced small carriers from the market, discouraged equipment investment, and pressured fleet profitability. That capacity correction is now colliding with higher operating costs and a freight base that no longer needs to boom before certain lanes tighten.
This distinction matters. A rate increase built on strong demand can support broad carrier expansion. A rate increase built primarily on reduced supply can be fragile and geographically uneven. It can also surprise shippers who assume soft national volume guarantees easy capacity everywhere.
WHAT SHIPPERS SHOULD DO
Shippers should not treat the 4.1% decline in Cass shipments as permission to pursue price alone. National averages can conceal lane-level and commodity-level pressure. Routing guides should be tested for actual acceptance, not merely contractual coverage.
The smartest near-term approach is to identify fragile lanes before they fail: markets with limited backhaul, seasonal refrigerated demand, repeated tender rejections, appointment constraints, or a shrinking qualified-carrier pool. Procurement teams should compare service failures and accessorial costs alongside the linehaul rate. A cheap award that falls through repeatedly is not a low-cost transportation solution.
Shippers should also examine fuel-adjustment mechanics and budget assumptions. Cass expenditures increased partly because rates and other cost pressures rose while volumes stepped back. Transportation budgets based only on shipment forecasts can therefore understate total spend.
WHAT CARRIERS SHOULD DO
Carriers should resist interpreting firmer pricing as a universal green light for rapid expansion. The volume signal remains cautious. Capacity discipline, lane profitability, driver productivity, maintenance control, and customer quality are more important than fleet growth for its own sake.
The best opportunity is selective: use improving pricing to repair margins on freight that fits the network. Carriers should know the true contribution of each lane after empty miles, detention, repositioning, insurance, maintenance, and driver time. This phase of the cycle rewards operational precision.
WHAT FREIGHT BROKERS SHOULD DO
For brokers, a supply-led recovery raises the value of execution. When capacity becomes less forgiving, accurate carrier availability, realistic pricing, strong vetting, and early communication become competitive advantages.
Brokers should avoid using yesterday’s buy rate in a changing lane. They should also separate “available” capacity from qualified capacity. The cost of fraud, double brokering, cargo theft, insurance gaps, or a poorly matched carrier can overwhelm the margin on many successful loads.
The broker’s role is not merely to find a truck. It is to manage the risk between a shipper’s service requirement and a carrier market that can change faster than the customer’s procurement cycle.
THE SIGNAL TO WATCH NEXT
The next stage of the cycle depends on whether demand begins to support the rate movement already created by tighter supply. Watch Cass shipments, tender behavior, industrial production, imports, inventories, and truck-transportation employment together. No single index can tell the whole story.
If shipment volumes begin improving while capacity remains disciplined, the market could move from a narrow supply-led rate recovery into a broader freight upcycle. If demand remains weak, rates may continue to rise selectively without producing uniform strength across modes, regions, or commodities.
The immediate message is clear: soft volume no longer means static transportation cost. Decision-makers should plan for a market in which capacity quality and lane-specific execution matter more than the national headline.
Eric Bratton’s View
The most important operational mistake in this market would be waiting for a dramatic volume surge before adjusting strategy. By the time a national index confirms broad strength, vulnerable lanes may already be expensive and service failures may already be appearing. Shippers, carriers, and brokers should respond to the direction of the underlying signals—not wait for every indicator to turn green at once.
Sources
Cass Transportation Index Report, June 2026: https://www.cassinfo.com/freight-audit-payment/cass-transportation-indexes/june-2026
American Trucking Associations, ATA Truck Tonnage Index Rose 0.1% in June: https://www.trucking.org/news-insights/ata-truck-tonnage-index-rose-01-june
Federal Reserve Bank of St. Louis / U.S. Bureau of Labor Statistics, Truck Transportation Employment: https://fred.stlouisfed.org/series/CES4348400001