
FIR rail and intermodal intelligence
RailTempo
A decision-focused reading of rail demand, traffic mix and service reliability across North American freight networks.
Current RailTempo reading
U.S. rail demand strengthened in the latest reported week, with growth extending across intermodal and carload traffic. The evidence supports a positive demand classification, but not yet a universal service-performance grade.
Observation period: Week ending October 17, 2026 | Released: October 21, 2026 | Next scheduled traffic update: Weekly
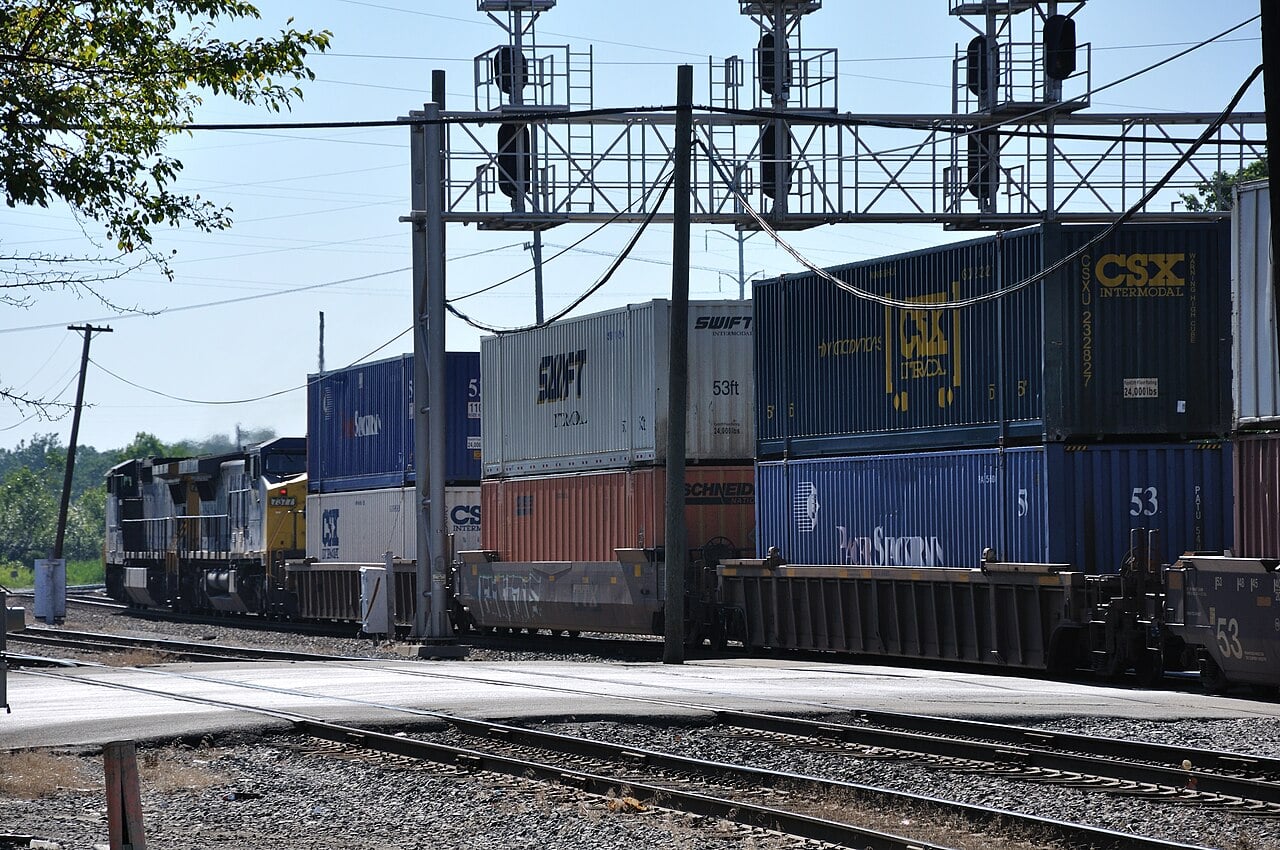
Intermodal, carload and total U.S. rail traffic all exceeded the comparable 2025 week. Nine of ten reported carload commodity groups increased.
The traffic direction is supported by broad weekly comparisons and year-to-date growth. Confidence is not rated high because a single national week cannot establish lane-level service, capacity absorption or persistence.
What changed
For the week ending October 17, U.S. intermodal traffic rose 12.6% year over year, carloads 3.5% and combined traffic 8.5%. Through 41 weeks, combined traffic was 21,062,681 carloads and intermodal units, up 3.7%. The national demand classification remains strengthening; weekly totals are not seasonally adjusted and do not establish lane-level reliability.
Where the strength came from
Nine of ten carload commodity groups increased. Metallic ores and metals rose 2,946 carloads to 23,306; grain rose 1,470 to 22,486; and farm products excluding grain and food rose 1,103 to 18,776. Nonmetallic minerals fell 1,089 to 32,428. Growth was broad but did not extend to every commodity.
What it means
For shippers considering rail or intermodal, the demand picture supports early checks on equipment, terminal capacity, drayage windows and inventory protection rather than assuming that national growth will translate into service failure. For railroads and intermediaries, simultaneous intermodal and carload gains increase the importance of distinguishing productive density from emerging network friction.
What could change the interpretation
- Confirmation: continued multiweek volume growth accompanied by stable or improving train speed, terminal dwell, original estimated arrival performance and industry spot/pull execution.
- Warning: rising traffic paired with slower speeds, longer dwell, missed local service windows or deterioration concentrated at major gateways.
- Reversal: broad weakening across both intermodal and economically sensitive carload groups rather than a decline isolated to one commodity.
The FIR RailTempo™ signal framework
RailTempo is designed as a layered diagnostic, not a renamed traffic index. Each layer answers a different decision question and remains visible so readers can see when demand and service disagree.
Demand and traffic mix
Carloads, intermodal units, commodity breadth and geographic mix show how much freight is entering the network and where operating requirements may be changing.
Network fluidity
Train speed and terminal dwell indicate whether traffic is moving efficiently through linehaul and yard operations. Carrier definitions and networks must be normalized before aggregation.
Shipment reliability
Original estimated time of arrival measures whether manifest shipments reach destination within the defined delivery window. Industry spot and pull measures execution at customer facilities.
Exceptions and resilience
Weather, border conditions, recrews, cars held, local cancellations, corridor events and safety disruptions help distinguish broad pressure from isolated operating exceptions.
How the signals should be read together
| Observed pattern | FIR interpretation | Decision check |
|---|---|---|
| Demand up; service stable | Productive network absorption is more likely than broad congestion. | Confirm equipment and terminal conditions on the lane. |
| Demand up; service weakening | Growth may be outrunning available operating capacity. | Protect inventory, review alternate gateways and test transit variability. |
| Demand down; service weakening | Volume alone does not explain the deterioration; an operating disruption or structural change may be present. | Review carrier, division, terminal and exception data. |
| National measures stable; local metrics weaken | A corridor or facility problem may be hidden by the aggregate. | Give shipment-level and terminal evidence priority. |
Where RailTempo supports decisions
- Modal conversion: test whether rail economics are supported by service reliability and terminal conditions on the actual lane.
- Inventory planning: identify when transit-time protection or safety stock may be warranted.
- Routing and gateway selection: compare local constraints rather than relying solely on national averages.
- Carrier reviews: bring dated demand, fluidity and execution evidence into performance discussions.
- Risk monitoring: distinguish a short-lived exception from a persistent, multi-signal deterioration.
Sources and methodology notes
- Association of American Railroads, week ending October 17, 2026: U.S. and North American carload and intermodal traffic; released October 21, 2026.
- Association of American Railroads, week ending August 8, 2026: earlier comparison point; released August 12, 2026.
- Surface Transportation Board EP 787 service metrics: definitions and July 8, 2026 initial reporting date for original estimated time of arrival and industry spot/pull.
- Surface Transportation Board rail service data: weekly carrier-reported operating metrics and methodology documents.
Data status: AAR release of October 21, 2026; no revision flagged in that release. Counts cover U.S. reporting railroads, in carloads and intermodal containers/trailers. U.S. totals are kept separate from AAR’s wider North American universe. Year-to-date comparisons cover 41 weeks; traffic counts are not prices or service scores.
FIR classification method: “Strengthening” is a directional demand assessment requiring agreement across intermodal, carload and combined traffic plus positive commodity breadth. It is not a carrier service grade, price forecast or claim about every lane. FIR will not publish a composite RailTempo score until the service series has sufficient history for comparability, normalization and stability testing.
Follow material changes in rail conditions.
Join the Freight Intel Briefing for updated readings, source-backed analysis and decision context.
Interpretation limits: Public railroad metrics do not represent every train, terminal, customer or shipment. Definitions can differ across reporting railroads, and systemwide averages may conceal lane-specific conditions. Traffic figures are measured facts reported by AAR; the directional classification and analysis are FIR interpretations. Updated October 23, 2026.
Government services: For government services, verification, registrations, forms, reporting, or instructions, always navigate to the official agency website directly. Independently verify its address before entering credentials or business information.