Tag: GDP

  • The GDP Headline Says Slowdown. Freight Demand Says Something Else.

    The GDP Headline Says Slowdown. Freight Demand Says Something Else.

    U.S. economic growth slowed in the second quarter, but the freight-relevant details tell a different story: domestic demand strengthened, equipment investment surged and an important LTL carrier reported improving tonnage—while inflation increased the pressure on transportation budgets.

    By Eric Bratton, Founder and Executive Editor, Freight Intel Report

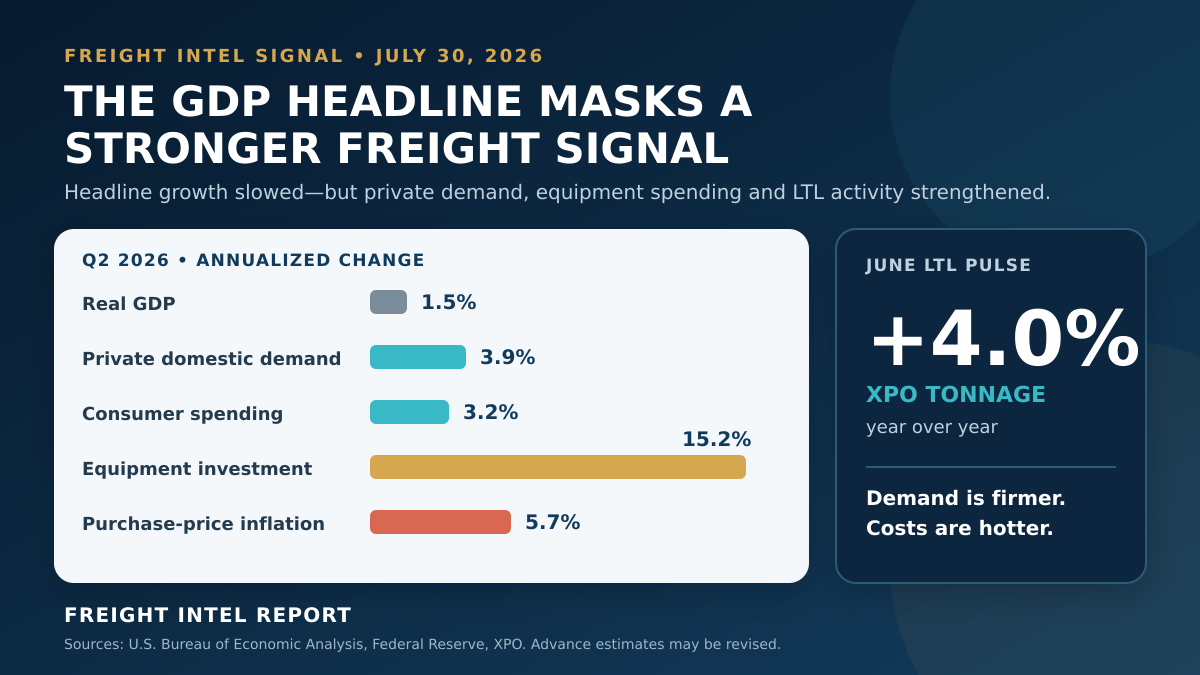
    The signal in six numbers

    • 1.5%: Q2 real GDP growth, annualized
    • 3.9%: real final sales to private domestic purchasers
    • 3.2%: consumer-spending growth
    • 15.2%: business investment in equipment
    • 5.7%: increase in the gross domestic purchases price index
    • 4.0%: XPO’s June LTL tonnage growth from a year earlier

    Quarterly economic figures are seasonally adjusted annual rates. XPO’s tonnage figure is a separate company-specific, year-over-year measure.

    The 1.5% headline is only part of the picture

    The Bureau of Economic Analysis’s advance estimate shows that real gross domestic product increased at a 1.5% annualized rate in the second quarter of 2026, down from 2.1% in the first quarter. On its face, that suggests a broad loss of momentum.

    But GDP was held down by a wider trade deficit and an inventory drawdown. Those accounting effects can weaken the headline even when spending inside the United States remains healthy. A better gauge of underlying private demand—real final sales to private domestic purchasers—rose 3.9%, its strongest pace in roughly three years. Consumer spending advanced 3.2%, while equipment investment jumped 15.2%.

    That split matters for freight. Goods still have to move when households buy and businesses install equipment, even if imports and inventory changes make the top-line GDP number look softer.

    Why freight decision-makers should care

    Real final sales to private domestic purchasers combines consumer spending with fixed business investment. It is therefore closer to the demand that many shippers, carriers and brokers experience than the headline GDP figure alone.

    The equipment-investment surge is especially relevant to industrial supply chains. Computers, machinery, electrical equipment and related components generate inbound, interfacility and final-mile freight. The artificial-intelligence and data-center buildout is part of that story, but the transportation implications extend to construction materials, power infrastructure, maintenance supply and specialized handling.

    This is not evidence that every lane, mode or commodity is accelerating. It is evidence that transportation planners should be careful about using slower GDP growth as a reason to assume immediate, broad-based freight relief.

    The carrier signal is improving—but it is not yet universal

    XPO reported that its June less-than-truckload tonnage increased 4% from a year earlier and said manufacturing activity was broadening beyond AI-related spending. Because LTL freight has substantial exposure to industrial and manufacturing customers, that is an important real-economy signal.

    It must also be interpreted correctly: XPO’s tonnage is one carrier’s company-specific result, not a complete market index, and LTL does not represent the entire truckload, parcel, rail or ocean market.

    The Federal Reserve’s June industrial-production report provides useful confirmation. Total industrial production edged up 0.1% in June and grew at a 4.0% annualized rate in the second quarter. Manufacturing output was unchanged in June but increased at a 4.7% annualized rate for the quarter. Together, those figures point to firmer industrial activity than the GDP headline alone implies.

    The inflation problem is moving in the wrong direction

    The same report carries a warning. The gross domestic purchases price index climbed at a 5.7% annualized rate, the fastest pace in four years. Freight demand may be improving before transportation costs have normalized.

    For carriers, that can mean renewed pressure from diesel, equipment, wages, insurance and financing. For shippers, it can mean higher fuel surcharges, less room for aggressive rate reductions and greater budget volatility. A demand recovery does not automatically produce a margin recovery—especially if operating costs rise first.

    What shippers, carriers and brokers should do now

    Shippers

    • Recheck routing-guide depth and backup-carrier coverage in industrial and equipment-heavy lanes.
    • Stress-test second-half transportation budgets against higher fuel and operating costs.
    • Avoid treating slower GDP as proof that capacity will remain inexpensive across every market.

    Carriers

    • Protect yield and fuel-recovery mechanisms rather than chasing unprofitable volume.
    • Watch density, empty miles and customer mix as industrial demand changes.
    • Separate genuine market improvement from one-time project freight and company-specific gains.

    Brokers

    • Revalidate committed capacity and fuel terms before promising low-cost coverage.
    • Track the spread between contract and spot conditions in industrial corridors.
    • Use mode- and lane-specific evidence; a national headline can conceal very different local conditions.

    What remains uncertain

    The BEA figures are an advance estimate and are scheduled for revision on August 26. Consumer strength could also fade if higher energy costs, persistent inflation or lower savings constrain spending. And the improvement visible in LTL and industrial production still needs confirmation from truckload volumes, tender data and a broader set of carrier results.

    The next decision points include July manufacturing data, employment, diesel prices, tender volumes and rejections, and additional carrier earnings. Those indicators will show whether the improvement is broadening or remains concentrated.

    The Freight Intel View

    The freight market is not receiving a clean all-clear signal. It is receiving a more consequential one: demand may be firming before cost pressure has normalized. That combination rewards preparation, pricing discipline and accurate capacity planning.


    Sources

    Data note: Quarterly growth rates are annualized unless otherwise stated. XPO tonnage is a June year-over-year company metric and is presented separately. BEA figures are advance estimates and may be revised.
