
A manufacturer waiting for a cheaper ocean booking can erase the saving if a late component forces an air shipment. That is the practical November freight problem: some prices are easing, but the cost of recovering from a missed delivery may not be.
The latest readings point in different directions. Drewry’s November 5 global container index declined 1% in a week, while DAT’s latest weekly truck spot linehaul averages rose and October airfreight pricing increased. Shippers have opportunities to negotiate, but those opportunities depend on the mode, lane and delivery deadline.
FIR’s November view: negotiate transportation with delivery flexibility; protect shipments that have little recovery time. The deciding variable is not whether the whole freight market is tight. It is how much time and money a particular shipment can afford to lose.
The six-panel market snapshot
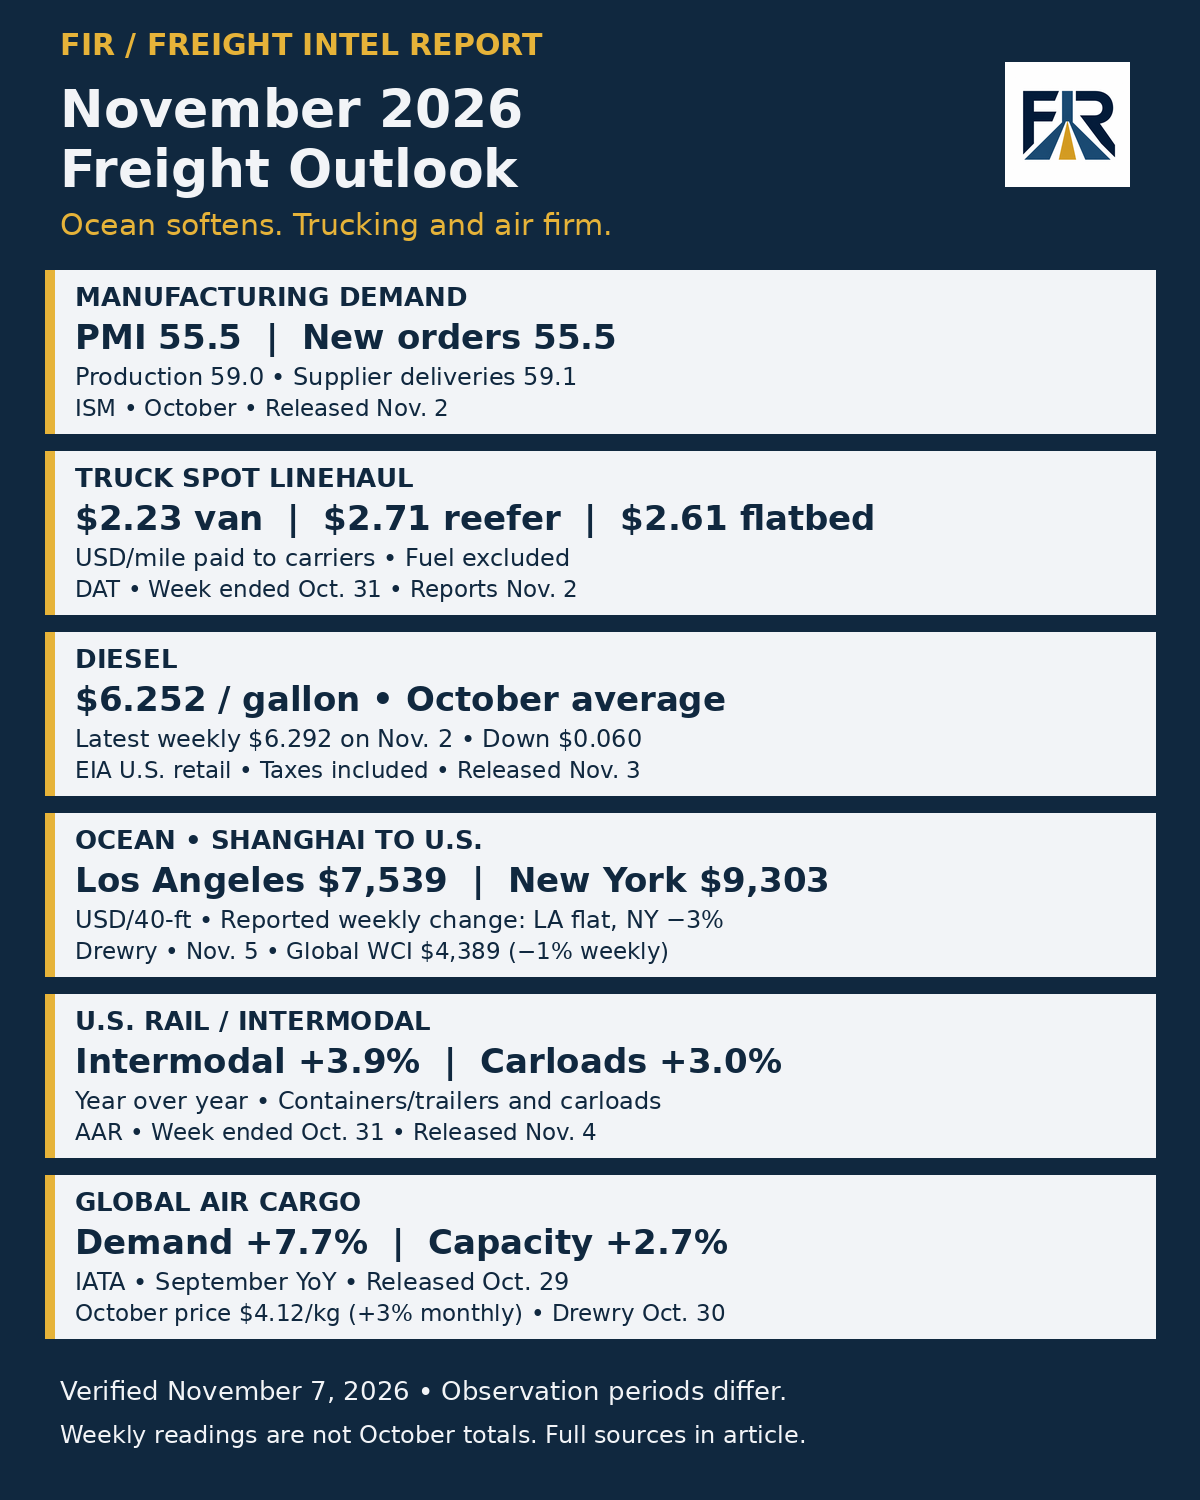
The six-panel data snapshot uses different observation periods deliberately. Manufacturing and airfreight pricing cover October. Air-cargo demand covers September. Truck and rail readings cover the week ending October 31, ocean assessments cover November 5, and diesel includes the October average and November 2 weekly observation. Each is the latest qualified observation used at the November 7 check. Use the dated measures alongside current shipment quotes.
Data availability at this check: DAT’s latest verified monthly TVI release still covers September, and IATA’s latest verified demand report also covers September. A full October AAR monthly total was not verified. This Outlook uses the latest verified weekly rail and truck readings and explicitly identifies those periods. We will follow subsequent releases and update the assessment as evidence changes.
Manufacturing is strengthening, but delivery time deserves attention
ISM’s October Manufacturing PMI reached 55.5, compared with 54.5 in September. New orders registered 55.5 and production 59.0. Supplier deliveries were 59.1; in that index, a reading above 50 indicates slower deliveries, not better service. The October report was released November 2.
These are survey measures—not tons, truckloads or a direct measure of freight capacity. For a manufacturer, their practical value is as a reason to revisit the gap between supplier promises and the dates materials actually become available to ship.
Action: identify components whose late arrival would interrupt production. Confirm cargo-ready dates and usable inventory coverage before deciding whether to wait for a lower transportation rate. Prioritize those components rather than paying a premium across every inbound lane.
Truckload: separate linehaul changes from the fuel bill
DAT’s November 2 public reports for the week ending October 31 showed national spot linehaul averages paid to carriers of $2.23 per mile for dry van, $2.71 for refrigerated equipment and $2.61 for flatbed, excluding fuel. The respective reports state weekly increases of $0.03, $0.03 and $0.01 per mile. These averages describe sampled transactions, not a shipper’s guaranteed price or a finalized October monthly average.
Separately, EIA’s October monthly U.S. retail diesel average was $6.252 per gallon, compared with $6.291 in September and $3.679 in October 2025. FIR calculates a 0.6% monthly decline and 69.9% annual increase.
The latest weekly observation, November 2, was $6.292 per gallon, down $0.060 in a week and up $2.539 from a year earlier. The monthly table and weekly release were published November 3; the next listed release is November 10. The weekly reading is November data, not an October average.
FIR analysis: a weekly fuel decline does not establish that a shipment’s total invoice has fallen. Compare bids using the same fuel formula, reference week, mileage basis and accessorial assumptions. Otherwise, apparent savings may simply move from one invoice line to another.
Action: reprice lanes where carrier acceptance and service have remained dependable. For critical lanes, retain a qualified backup and verify actual acceptance before reducing committed coverage. Neither the national spot average nor diesel alone establishes a local capacity shortage.
Ocean: negotiate the rate without giving away the arrival date
Drewry’s November 5 World Container Index was $4,389 per 40-foot container, down 1% week over week. Shanghai-to-New York was $9,303, down 3%, while Shanghai-to-Los Angeles was $7,539, described by Drewry as unchanged. These are the publisher’s current assessments and reported weekly changes. They exclude the separate inland delivery decision.
Drewry’s November 6 sailing tracker expects 46 cancellations out of 717 planned East–West sailings between November 9 and December 14, approximately 6%. That is a forward schedule estimate and can change. A softer rate environment still requires a confirmed departure and recovery option.
Request fresh offers for cargo with schedule flexibility. Match each offer to its sailing and destination because discounts and service availability vary by route.
Action: compare the sailing, cutoff, transshipment arrangement, free time and final delivery plan alongside the ocean rate. Obtain the next workable departure if the selected sailing fails. A lower quote has less value when its recovery option misses the customer’s required date.
Air cargo: preserve the recovery option before it becomes urgent
IATA reported September global cargo demand growth of 7.7% year over year, measured in cargo tonne-kilometers, against capacity growth of 2.7%, measured in available cargo tonne-kilometers. The release was published October 29 and remained the latest qualified IATA demand report verified at this check. The five-percentage-point growth gap is not a five-percent capacity shortage. It does show demand growing faster than available capacity in the aggregate.
Drewry’s October Airfreight Price Index was $4.12 per kilogram, up 3% month over month, published October 30. It measures forwarders’ all-in airline buy rates for standard airport-to-airport services on 44 East–West routes and cargo above 1,000 kilograms. Treat emergency small-shipment quotes and final delivery charges separately.
Action: identify the small portion of inventory that could justify air freight if ocean or production timing slips. Obtain a dated recovery quote, routing and acceptance conditions in advance. Do not assume a quote for a small emergency shipment applies to a full delayed order.
Rail and intermodal: growth is a signal, not a service guarantee
AAR’s November 4 release reported 280,264 U.S. intermodal containers and trailers in the week ending October 31, up 3.9% year over year, and 233,816 carloads, up 3.0%. Combined traffic was 514,080 units, up 3.5%. These are weekly observations, not October monthly totals. The preceding October 24 week’s 11.3% intermodal growth is a separate year-over-year comparison, not the change from one week to the next.
Those figures establish traffic growth. They do not establish terminal congestion, available slots or door-to-door reliability for a particular route.
Action: test an intermodal alternative with origin drayage, terminal cutoff, rail transit, destination availability and delivery appointment included. Require a recovery plan for a missed connection. Convert freight with sufficient schedule tolerance before assigning time-critical replenishment to a new routing.
LTL, barge and drayage need narrower evidence
There is no defensible reason to apply truckload spot averages to an LTL shipment. LTL decisions should be tested against the actual tariff or contract, minimum charge, classification, dimensions, fuel and likely accessorials. Compare the total cost for representative shipments and the service record for the terminals involved.
USDA’s November 5 Grain Transportation Report lists the November 3 Illinois River southbound barge rate at $33.59 per short ton, compared with $33.92 on October 27. The report places it 20% above the comparable week last year. This is an agricultural river-route measure. Grain shippers should obtain current barge and rail offers, confirm loading limits and terminal transfer costs, and compare the complete route before switching modes.
Drayage remains port- and terminal-specific. Check appointment availability, chassis arrangements, container availability and free-time deadlines before interpreting a lower ocean rate as a lower delivered cost. Comparable current national LTL and drayage prices were not verified for this review. Use written shipment quotes and terminal conditions for those decisions.
Before delaying a booking, compare actual shipment costs
Obtain current written quotes for the available departures and confirm their validity, cargo cutoffs and delivery commitments. Compare the full delivered cost, including fuel, inland transportation, handling and applicable accessorial charges.
Then document the consequences of missing the required delivery date using the shipment’s actual inventory coverage, production requirements and customer commitments. Obtain a recovery quote where an alternative service is available. Identify costs that remain unknown rather than assigning invented amounts or failure probabilities.
A lower transportation quote is not a demonstrated saving until the available service can meet the shipment’s requirements. Base the decision on documented prices and shipment consequences—not a national benchmark or a hypothetical financial scenario.
Three November scenarios—and what would change the decision
- Rates soften without service deterioration. If fresh lane quotes improve while acceptance and on-time performance remain stable, competitively reprice flexible freight. Retain the service terms that made the saving usable.
- Demand absorbs available capacity. If bookings require longer lead times, acceptance falls or delivery performance deteriorates on an exposed lane, secure its required capacity earlier. National volume growth alone is not enough to trigger this response.
- Operating costs rise while freight demand stays uneven. If fuel increases but linehaul and service evidence remain stable, update the fuel budget and audit contractual pass-through. Do not automatically accept the same increase in base transportation rates.
These are conditional planning cases, not probability-weighted forecasts. Revisit them when shipment-level evidence changes.
What to do this week
- Rank the next month’s shipments by the financial consequence of a late arrival.
- Request current all-in and itemized quotes for flexible ocean and truckload movements.
- Confirm cargo-ready dates, inventory coverage and recovery options for production-critical freight.
- Check fuel formulas against the correct observation date and contract lag.
- Revisit decisions when lane acceptance, lead times or service outcomes change—not merely when a national headline changes.
Buy time where a missed date is expensive and preserve price flexibility where the business can tolerate it. FIR will follow the next releases and service developments and update the decision implications when the evidence changes.
Sources and observation notes
Primary sources checked November 7, 2026. The dates below identify the observation and release periods. Figures are benchmarks rather than shipment quotes.
ISM October Manufacturing PMI report, released November 2. PMI 55.5, new orders 55.5, production 59.0 and supplier deliveries 59.1.
DAT November 2 reports for the week ending October 31. Dry van, reefer and flatbed. Monthly release archive still listed September as the newest verified TVI release at this check.
EIA weekly diesel release and monthly U.S. diesel history, released November 3. FIR calculations use October $6.252, September $6.291 and October 2025 $3.679 per gallon. Rounded changes are −0.6% monthly and +69.9% annually. Next listed EIA release is November 10.
Drewry November 5 World Container Index and November 6 Cancelled Sailings Tracker. Weekly changes use Drewry’s reported comparison, rather than a calculation against an older FIR snapshot. Cancellations cover November 9–December 14 and remain estimates.
Drewry October Airfreight Price Index, dated October 30. IATA September demand and capacity release, published October 29. The demand/capacity growth-rate difference is 5.0 percentage points. October IATA demand totals were not verified.
AAR November 4 weekly rail release, covering October 31. October monthly totals are not inferred from that week. Year-to-date figures are omitted because the release’s stated week count needs reconciliation.
USDA November 5 Grain Transportation Report, table 9, printed page 18. Barge prices are for November 3 and October 27. One short ton equals 2,000 pounds.



Leave a Reply