
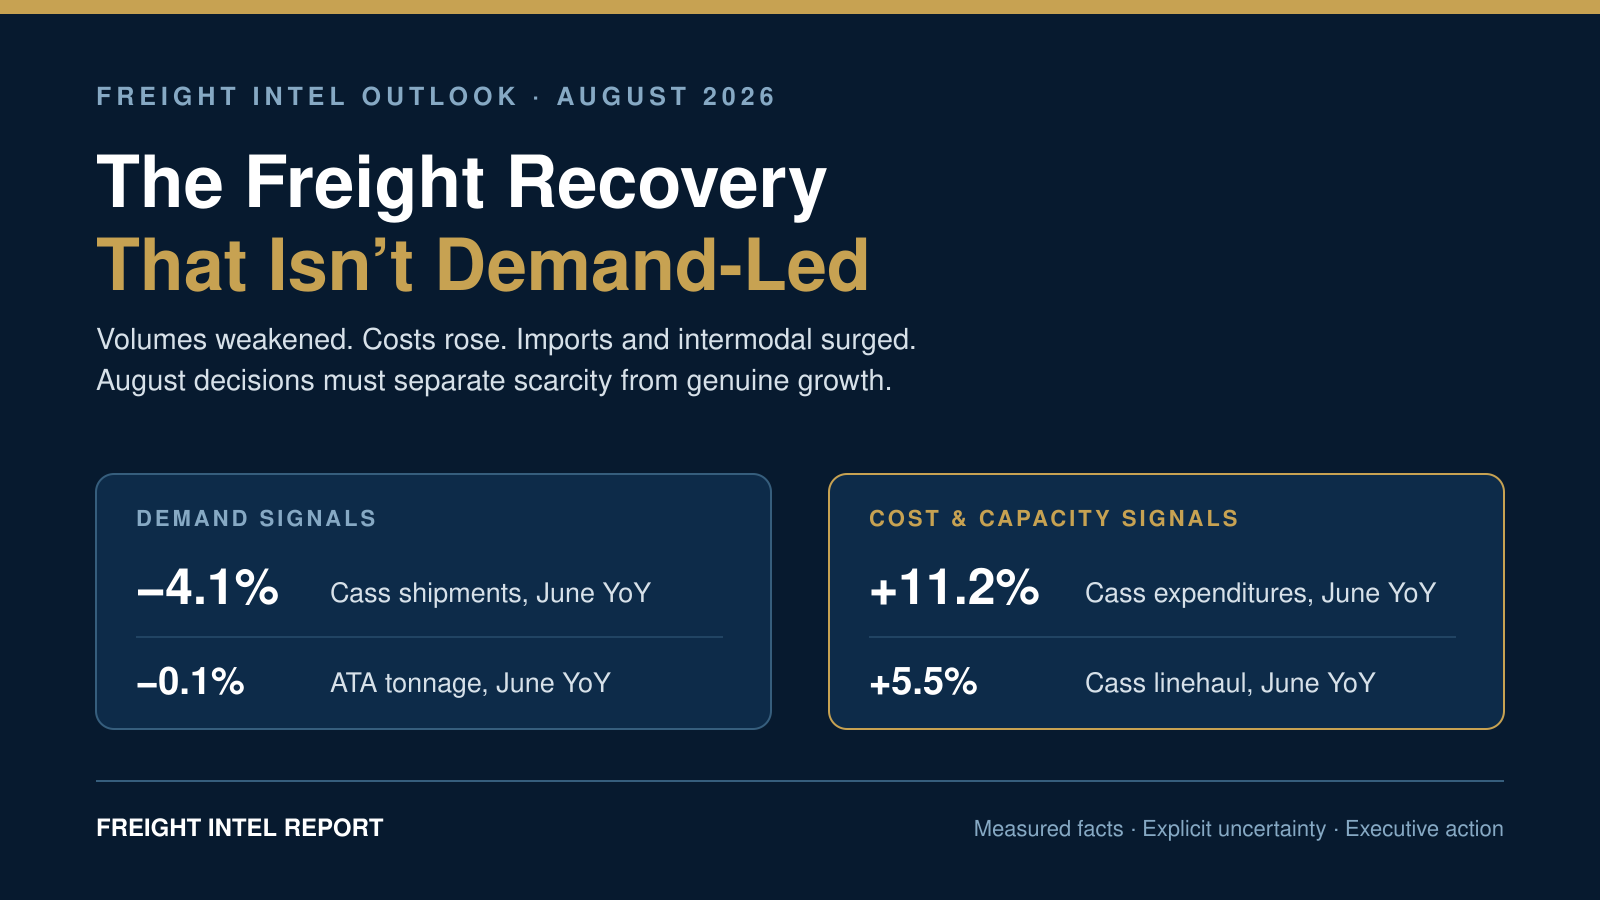
FREIGHT INTEL OUTLOOK · AUGUST 2026
Shipments and truck tonnage weakened while freight spending, linehaul pricing, port imports and intermodal traffic rose. The result is not a conventional freight recovery. It is a scarcity-driven cost cycle distorted by import pull-forwards, regulatory capacity pressure and uneven industrial demand.
Published August 3, 2026 · Updated September 4, 2026
Update — September 4, 2026: The Jobs Rebound Was Not a Freight Boom
The Bureau of Labor Statistics reported that U.S. payrolls rose by 162,000 in August and unemployment held at 4.1%. June and July were revised upward by a combined 55,000 jobs. The stronger national headline reduces immediate recession concern, but its composition does not establish a broad freight-demand recovery: food services added 59,000 jobs and local-government education added 42,000, while transportation and warehousing added only 5,000.
Inside logistics, truck transportation gained 4,800 jobs from July, but warehousing and storage lost 2,600 and couriers and messengers lost 3,000. Seasonally adjusted transportation-and-warehousing employment remained 51,500 jobs below August 2025, including 32,000 fewer warehousing jobs and 9,900 fewer trucking jobs.
FIR assessment: Consumer-service hiring and a modest manufacturing gain can support freight at the margin, but buyers should not treat the national payroll surprise as evidence that shipment volumes or warehouse demand have turned decisively upward. Continue to separate macroeconomic resilience from mode-, lane- and inventory-specific freight signals.
Shipper action: Keep capacity plans scenario-based, test carrier pricing against actual tender and volume data, and watch whether manufacturing hours, inventories and transportation employment confirm the headline over the next two releases.
The Freight Intel View
August’s central risk is misdiagnosis. Executives who see rising rates and record port activity may assume a broad demand boom is underway. Executives who see falling shipments may assume transportation budgets are safe. Both conclusions are incomplete.
The more defensible reading is that constrained truck supply, higher operating costs, front-loaded imports and mode shifting are raising transportation prices faster than underlying freight demand. Shippers should protect service on critical lanes without treating every rate increase as proof that end-market demand has accelerated.
Executive dashboard
| Signal | Latest reading | Executive interpretation |
|---|---|---|
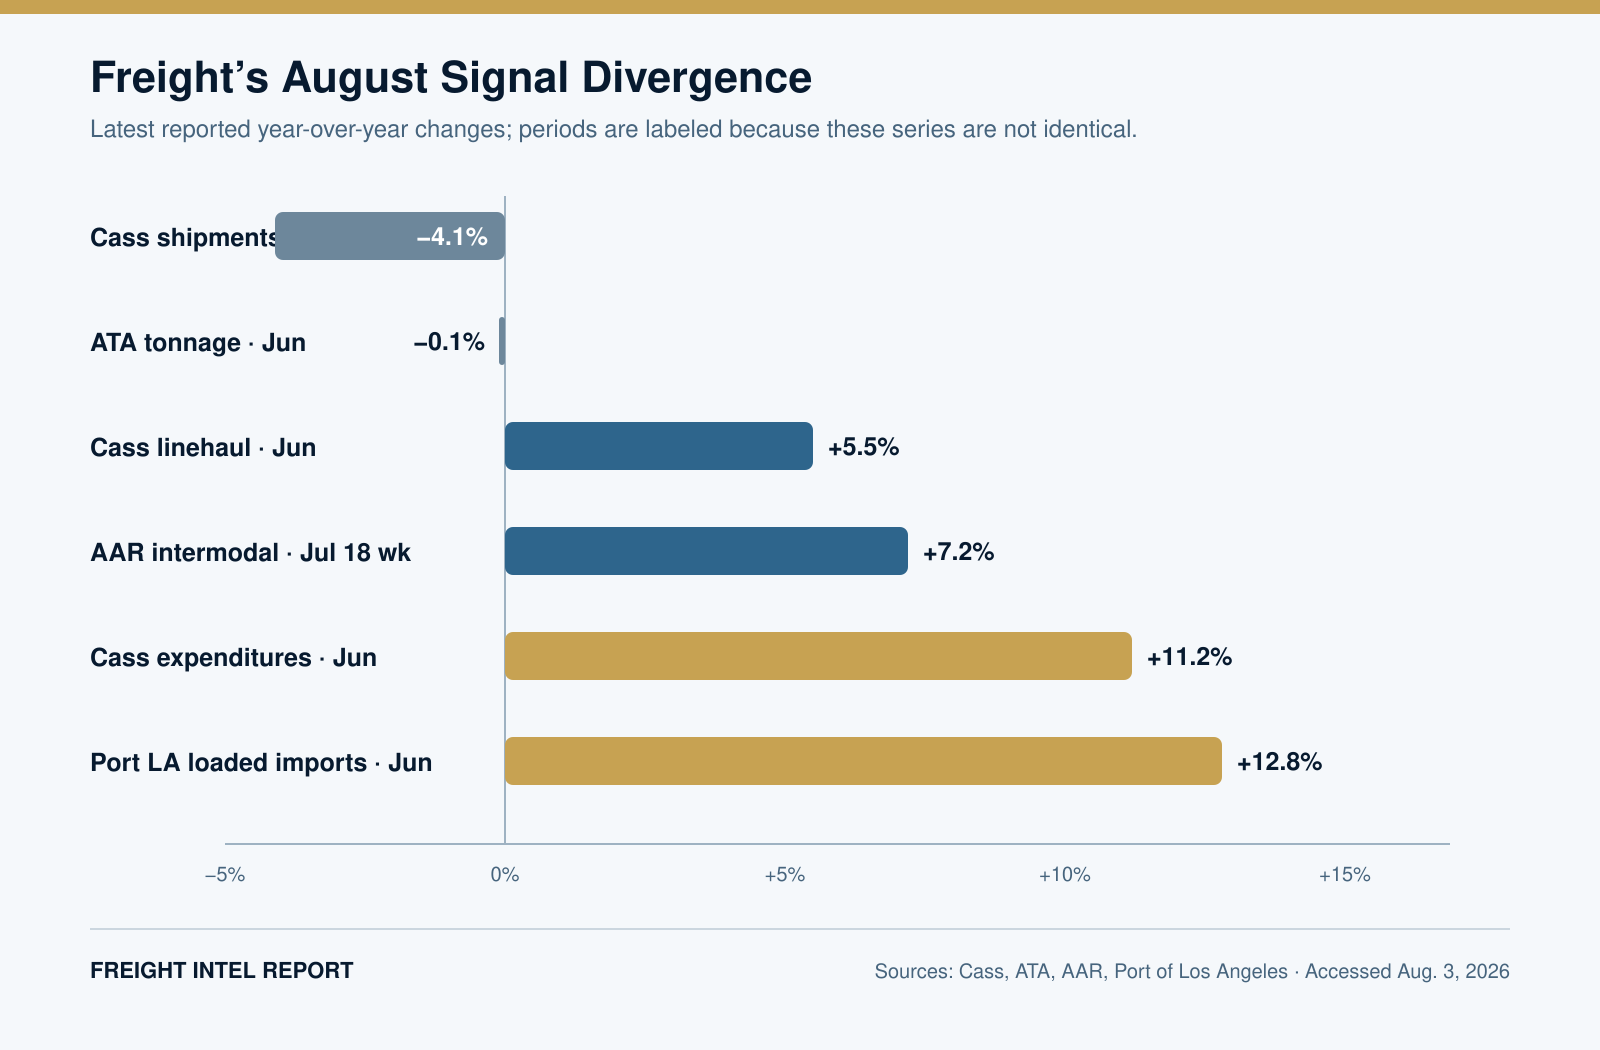
| Cass shipments | −4.1% YoY, June | Broad for-hire shipment activity remains weak. |
| Cass expenditures | +11.2% YoY, June | Transportation spending is rising despite lower shipment counts. |
| Cass truckload linehaul | +5.5% YoY, June | Pricing power is improving, but not because volumes are booming. |
| ATA truck tonnage | −0.1% YoY, June | Second-quarter freight weakened after a stronger first quarter. |
| Port of Los Angeles imports | +12.8% YoY, June | Import pull-forwards are distorting normal peak-season timing. |
| U.S. rail intermodal | +7.2% YoY, week ended July 18 | Rail is gaining from imports and widening truckload cost differentials. |
| U.S. retail diesel | $5.134/gal., July 20 | Fuel-surcharge timing and cash-flow exposure remain material. |
| China manufacturing PMI | 49.2 official / 50.9 private, July | China’s factory economy is uneven, not uniformly contracting or accelerating. |
Measured facts above use different populations and reporting periods. They are directionally comparable but should not be treated as one composite index.
Download the four-page August executive brief (PDF)
The contradiction is the story
The strongest freight-market signal is not any single index. It is the widening gap between volume and cost.
The Cass Freight Index reported June shipments down 4.1% from a year earlier and 2.9% lower from May on a seasonally adjusted basis. Yet Cass expenditures rose 11.2% year over year, and its truckload linehaul index increased 5.5%.
The American Trucking Associations found a similar demand picture. June tonnage edged up only 0.1% from May and remained 0.1% below June 2025. ATA also said tonnage contracted a combined 4.1% during April and May.
DAT provides the pricing side of the divergence. Its June Truckload Volume Index increased seasonally from May, but van volume was roughly flat year over year, refrigerated volume was down 8%, and flatbed volume was down 4%. At the same time, spot linehaul rates rose at least 39% year over year across all three equipment types. The national dry-van spot rate exceeded the contract rate for the first time since February 2022.
Why prices can rise without a volume boom
Freight pricing is the interaction of demand and available capacity—not a direct referendum on the economy. The June ACT For-Hire Trucking Index, reported by FreightWaves, put the freight-rate index at 70.2, still elevated despite retreating from May’s record. Its capacity index reached 55.0, but driver availability remained deeply constrained at 34.1.
That combination suggests larger fleets can add capacity selectively while the market still lacks enough qualified drivers and flexible small-carrier capacity to absorb disruptions cheaply. Holiday weeks, produce seasons, inspections, weather events and short-notice tenders therefore create disproportionate price moves.
C.H. Robinson’s July outlook raised its forecast for 2026 dry-van spot cost per mile to 34% above 2025 and refrigerated spot cost per mile to 35% above 2025. That is a commercial forecast—not an official statistic—but it is consistent with the observed rate-and-volume split.
The import surge is real—but its timing is abnormal
The Port of Los Angeles handled 1,002,734 TEUs in June, the busiest June in its history. Loaded imports reached 530,558 TEUs, up 12.8% from a year earlier. Port officials attributed the strength partly to retailers and manufacturers moving goods early as they navigated changing trade policy, rising fuel costs and global uncertainty.
For transportation planning, a pull-forward is not the same as organic consumption growth. It can tighten drayage, warehousing and inland transportation now while leaving a softer replenishment period later. It can also inflate inventory carrying costs if retail demand does not absorb the goods as quickly as expected.
This is why peak-season assumptions should be rebuilt from purchase orders, inbound bookings and sell-through—not from port throughput alone.
Intermodal has the clearest share-gain opportunity
For the week ended July 18, the Association of American Railroads reported U.S. intermodal volume up 7.2% year over year while carloads fell 1.2%. Through the first 28 weeks of 2026, intermodal was up 3.8% and carloads were up 2.9%.
That pattern is economically coherent. Higher truckload spot prices widen the set of lanes where rail can compete, especially for planned long-haul freight. Strong West Coast imports add container volume. Constrained driver supply makes guaranteed highway capacity more expensive.
The limitation is service design. Intermodal works best where shippers can provide lead time, predictable cutoffs, sufficient dwell tolerance and consistent origin-destination density. It is not a universal substitute for truckload.
U.S. demand is stronger than freight volume—but concentrated
The advance estimate showed second-quarter U.S. GDP growing at a 1.5% annualized rate, but private domestic demand rose 3.9%, consumer spending increased 3.2%, and equipment investment surged 15.2%. Those figures explain why the economy can look stronger than freight-shipment indexes: a significant part of growth is concentrated in equipment, technology and services rather than broad, high-cube goods movement.
The Federal Reserve reported that June industrial production rose 0.1%, while manufacturing output was unchanged for the month but grew at a 4.7% annual rate in the second quarter. The Census Bureau reported June durable-goods orders up 0.3%, led by computers and electronics.
Manufacturing is therefore not collapsing. It is also not producing a uniform freight wave. Metals, electronics, AI infrastructure and selected industrial equipment can strengthen while consumer goods, housing-related freight or other truck-intensive categories remain soft.
China’s factory data argues for supplier-level—not country-level—planning
China entered August with conflicting manufacturing signals. The official July manufacturing PMI fell to 49.2, indicating contraction, while the private RatingDog survey registered 50.9, indicating slower expansion. Reuters reported that the private survey’s export orders returned to slight growth, but purchasing activity declined and input inventories continued to build.
The practical conclusion is not that “China is weak” or “China is recovering.” It is that conditions differ by company size, export exposure, industry and region. U.S. importers should monitor confirmed supplier production schedules, booking data, raw-material inventories and export orders instead of relying on one national headline.
Forced-labor enforcement remains a material import risk. Media reports described an expansion of the UFLPA Entity List on July 31, but Freight Intel Report could not retrieve the underlying government notice during this report’s verification window. We therefore exclude the reported company count from the dashboard and do not treat entity names or aliases as confirmed here. Importers should screen against the live DHS list and preserve component-level supply-chain documentation rather than relying on media summaries.
Mode outlook
Truckload
Direction: Firm pricing, uneven volume, high event sensitivity. Contract rates will increasingly be tested where spot economics exceed routing-guide assumptions. Shippers should separate strategic lanes from transactional lanes and add backup depth before the holiday cycle.
Refrigerated
Direction: Seasonal pressure should ease from early-summer peaks, but constrained driver supply and fuel costs limit the depth of relief. Tight Texas and selected West Coast lanes deserve longer lead times and fewer appointment complications.
Flatbed
Direction: Industrial and infrastructure freight provide support even as housing remains soft. Conditions may ease seasonally, but data-center and manufacturing corridors can remain expensive.
LTL
Direction: Gradual firming rather than a surge. Higher truckload pricing can move fragmented freight back toward LTL networks. Shippers should audit classification, density, dimensions and accessorial exposure before general-rate increases compound errors.
Intermodal
Direction: Best relative opportunity for planned long-haul freight. Capacity should be reserved early in import-heavy and high-utilization markets. The decision should compare total landed service cost—not only linehaul.
Ocean and drayage
Direction: Strong inbound throughput with abnormal timing. Pull-forward volume may concentrate chassis, labor and appointment pressure without producing a conventional fall peak. Inventory and warehouse capacity should be linked to sell-through scenarios.
Three scenarios for August through October
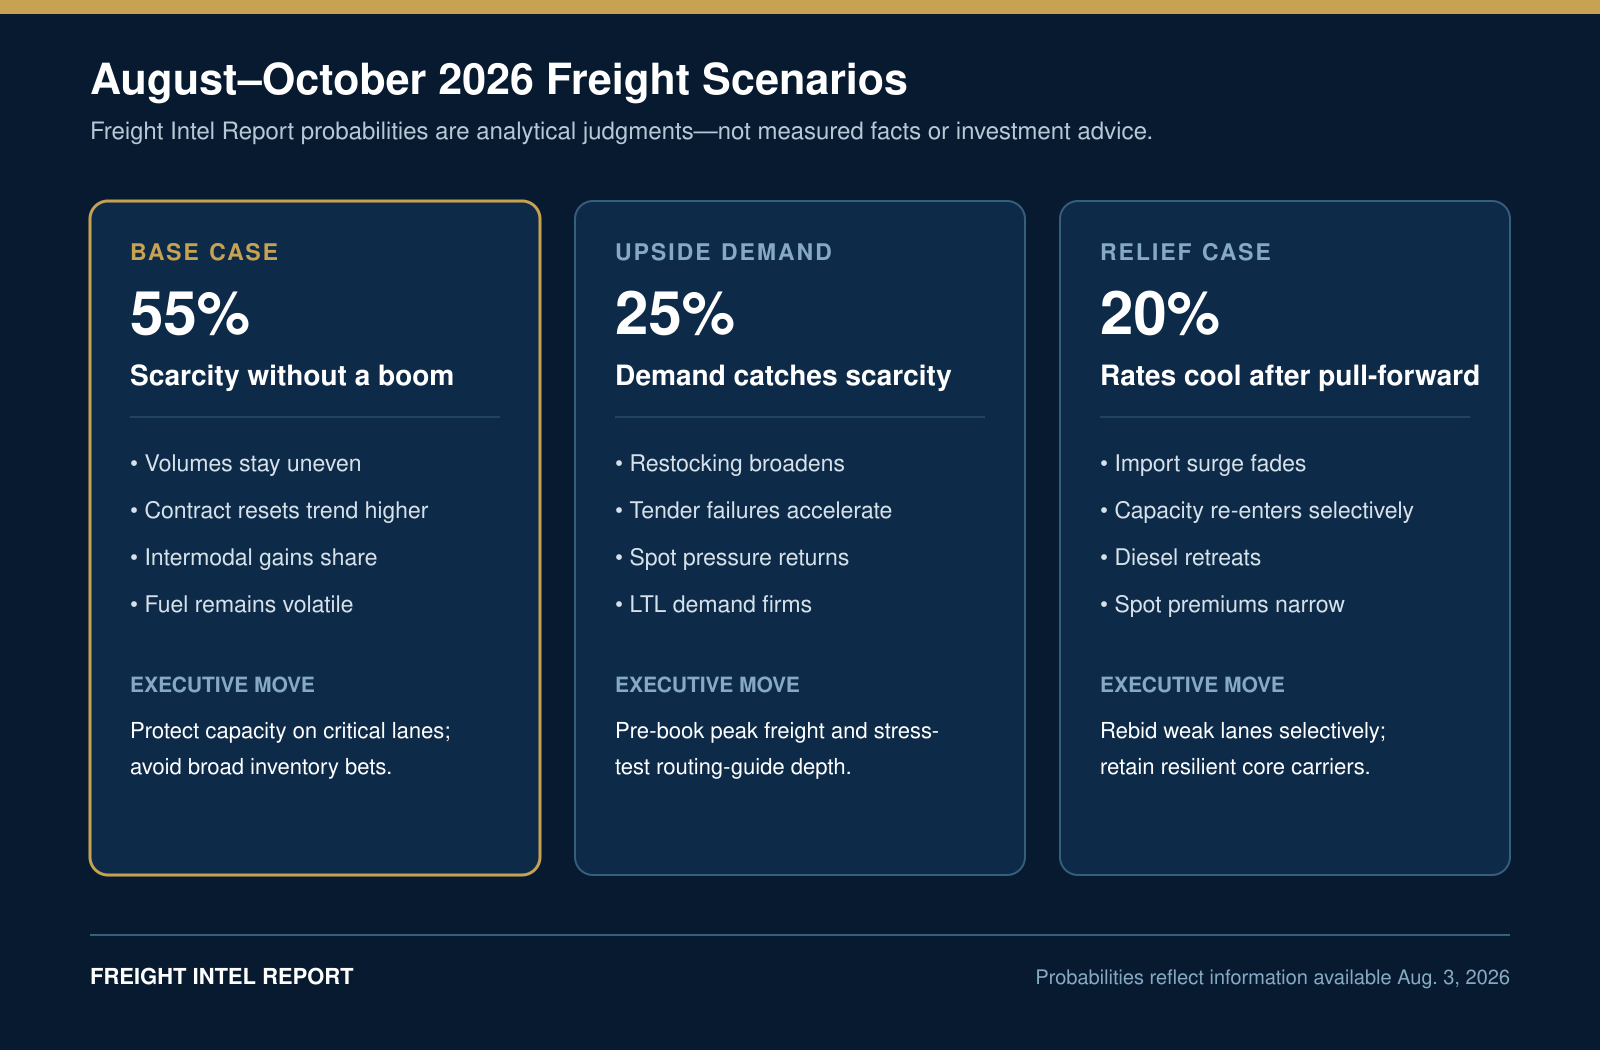
Base case—55%: scarcity without a boom
Volumes remain uneven, contract resets trend higher, intermodal gains share and fuel stays volatile. This is the most likely case because the current rate cycle has clearer supply-side support than broad demand support.
Upside-demand case—25%: demand catches scarcity
Restocking broadens, tender failures increase and LTL demand firms. In this scenario, stronger private domestic demand and manufacturing orders finally translate into truck-intensive freight while capacity remains constrained.
Relief case—20%: rates cool after the pull-forward
Imports fade, capacity re-enters selectively, diesel retreats and spot premiums narrow. Shippers gain negotiating room, but should avoid dismantling resilient routing guides for temporary savings.
Leading indicators to watch next
- Cass shipments versus expenditures: the divergence must narrow before calling this a balanced recovery.
- DAT spot-versus-contract spread: persistent spot premiums increase routing-guide and bid-cycle risk.
- Tender rejections and lead-time sensitivity: rising rejections without volume growth confirm capacity-driven pressure.
- Port imports versus retailer inventories: strong imports without matching sell-through raise a later-volume air pocket.
- AAR intermodal growth: sustained gains show whether mode conversion is structural.
- Diesel and fuel-surcharge lag: rapid fuel moves determine which party temporarily finances the shock.
- China new export orders and purchasing: these lead future bookings more directly than headline GDP.
- August 12 CPI and August 18 industrial production: both can materially change the inflation and goods-demand outlook.
Actions by stakeholder
For shippers
- Classify lanes by service criticality, spot exposure and modal convertibility.
- Stress-test routing guides at 10%, 20% and 30% tender-failure assumptions.
- Separate inbound inventory pull-forward from verified customer demand.
- Model fuel-surcharge timing, not only the final indexed charge.
- Secure intermodal capacity where lead time and service tolerance support it.
For carriers
- Price network fit and cash conversion—not headline spot rates alone.
- Avoid adding equipment based on temporary event premiums.
- Quantify fuel, insurance, maintenance and driver costs by lane.
- Prioritize customers with predictable dwell, appointments and payment.
For brokers and 3PLs
- Show clients where price increases are capacity-driven versus demand-driven.
- Increase carrier-verification discipline as scarce capacity raises fraud incentives.
- Build multi-mode alternatives before service failures occur.
- Track spot-contract spreads and tender recovery cost at the lane level.
For executives and finance teams
- Use scenario budgets instead of one transportation-cost forecast.
- Measure inventory carrying cost alongside freight savings from early imports.
- Review working-capital exposure created by fuel and payment-term mismatches.
- Treat service resilience as a financial control, not an operating preference.
What would change our view
Freight Intel Report would raise the probability of a true demand-led recovery if shipment counts, tonnage, manufacturing new orders and consumer-goods production strengthen together for multiple reporting periods. We would raise the relief-case probability if spot premiums, tender rejections, diesel and import volumes decline together without service deterioration.
Until then, the evidence favors a market in which transportation costs can rise faster than freight demand. That is a planning problem—but it is also an opportunity for disciplined shippers, carriers and brokers to outperform competitors who react only to headlines.
Methodology and source notes
This report compares the latest publicly available releases as of August 3, 2026. Cass, ATA, DAT, ACT, AAR and port measures cover different freight populations, modes and time periods. Freight Intel Report does not average them into a synthetic index. Reported values are identified as measured facts; third-party forecasts are attributed; scenario probabilities and recommendations are Eric Bratton’s analysis.
- Cass Transportation Index Report—June 2026
- ATA Truck Tonnage Index—June 2026
- DAT Truckload Market Update—June 2026
- ACT For-Hire Trucking Index coverage—June 2026
- Port of Los Angeles—June 2026 cargo
- AAR weekly rail traffic—week ended July 18, 2026
- Federal Reserve industrial production—June 2026
- Census durable-goods orders—June 2026
- BLS Consumer Price Index—June 2026
- EIA Gasoline and Diesel Fuel Update—week of July 20, 2026
- Reuters verification of the Q2 U.S. GDP release
- Reuters verification of China’s official July PMI
- Reuters verification of China’s private July PMI
Get the next decision before it becomes the consensus
Subscribe free to Freight Intel Report for the monthly Freight Intel Outlook, pivotal breaking analysis, regulatory changes, mode-by-mode implications and practical actions for shippers, carriers, brokers and supply-chain executives.
No manufactured urgency. No copied talking points. Just verified freight intelligence built for decisions.
Government services: For government services, verification, registrations, forms, reporting, or instructions, always navigate to the official agency website directly. Independently verify its address before entering credentials or business information.
Leave a Reply