
By Eric Bratton, Founder and Executive Editor, Freight Intel Report
October 15, 2026 | Freight Markets & Shipper Strategy
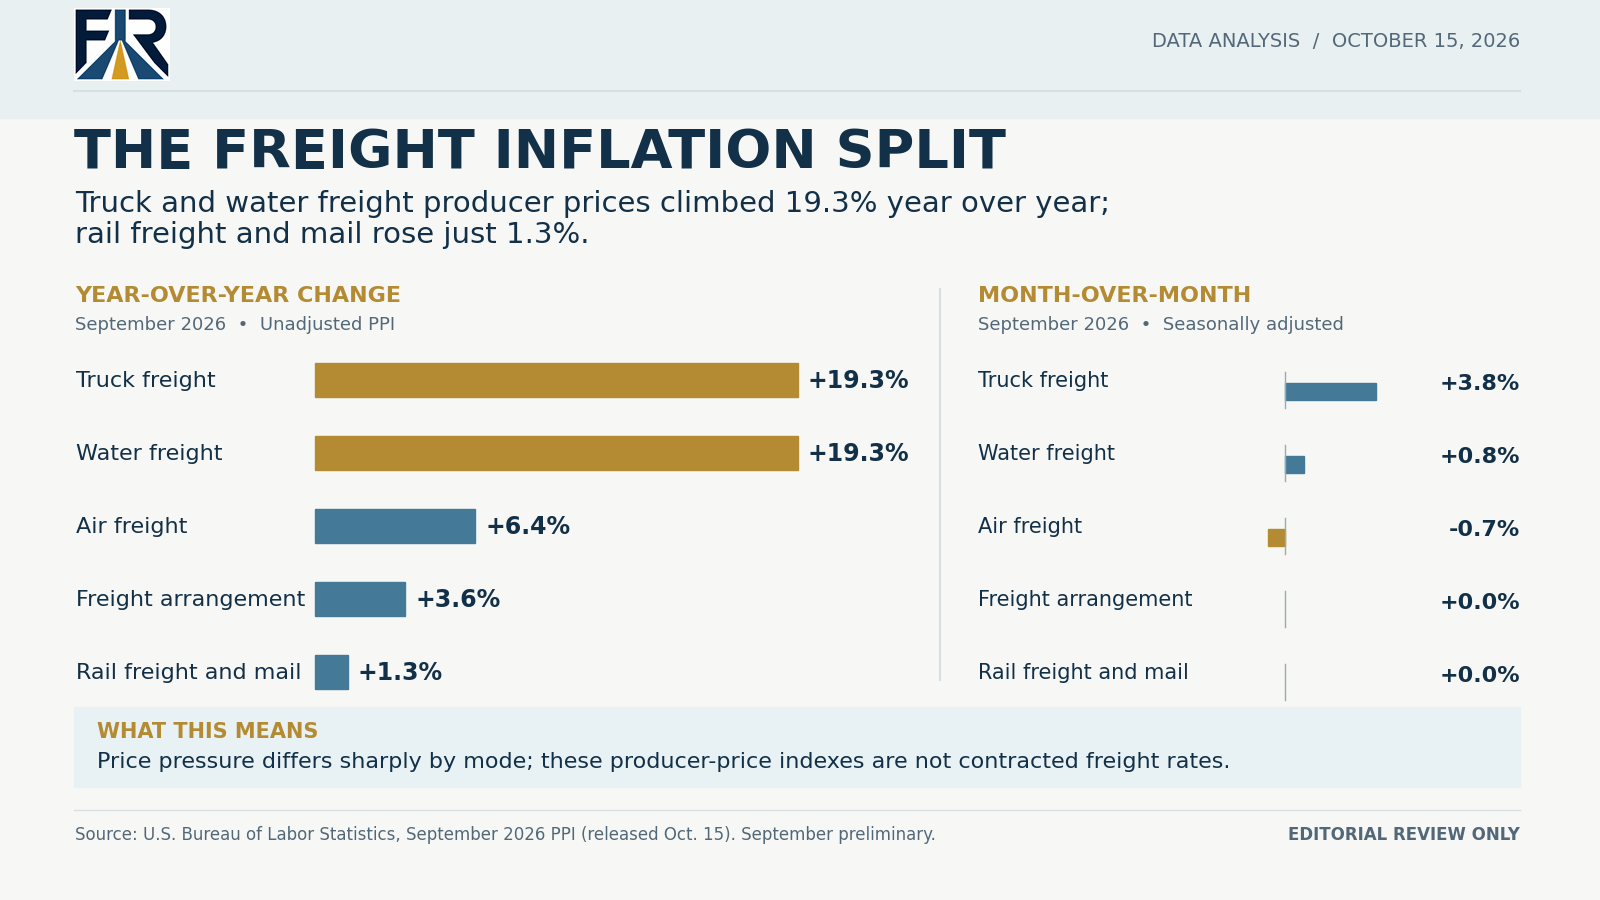
U.S. freight inflation is not moving in one direction at one speed. New federal data show that truck and water transportation producer prices increased 19.3% over the past year, while rail freight and mail prices rose only 1.3%.
That difference matters for companies purchasing transportation across multiple modes. A freight budget built around an overall inflation assumption can conceal substantial differences between the services a shipper actually buys.
The Bureau of Labor Statistics’ September Producer Price Index (PPI), released October 15, shows that trucking continues to experience significant price pressure, while rail, air freight, and freight arrangement services are following different trajectories.
FIR’s central finding: The widening divergence in freight producer-price indexes makes transportation mix and contract exposure increasingly important budgeting variables—but it does not establish that one mode is automatically cheaper than another.
Trucking and Water Freight Lead the Increase
The latest BLS figures reveal substantial differences in year-over-year transportation producer prices.
| Freight category | September 2026 YoY |
|---|---|
| Truck transportation of freight | +19.3% |
| Water transportation of freight | +19.3% |
| Air transportation of freight | +6.4% |
| Arrangement of freight and cargo | +3.6% |
| Rail transportation of freight and mail | +1.3% |
Source: U.S. Bureau of Labor Statistics, September 2026 Producer Price Index. Year-over-year changes are unadjusted.
Truck and water transportation registered increases 18 percentage points greater than rail freight and mail.
That is a substantial divergence in producer-price movements, although the indexes represent different service markets and should not be interpreted as directly comparable transportation prices.
The reported water transportation increase also should not be generalized to every international container route, inland waterway movement, or ocean shipping contract. Its coverage and pricing methodology differ from the commercial benchmarks shippers use when negotiating individual lanes.
For transportation buyers, the key question is how much of their company’s purchased freight exposure lies within the categories experiencing the strongest price increases.
September Reveals Another Important Difference
The month-over-month figures provide additional evidence that freight markets are not behaving uniformly.
Seasonally adjusted truck transportation producer prices increased 3.8% in September, following a revised 2.6% increase in August.
Water freight producer prices rose 0.8%.
Air freight producer prices declined 0.7%, while rail freight and mail and freight arrangement prices were unchanged.
These monthly changes do not necessarily predict how contract rates will move next quarter. They do, however, provide evidence that pricing pressure varies considerably across transportation service categories.
For shippers planning fourth-quarter transportation expenditures, that distinction warrants attention.
A company heavily dependent on truck transportation may face a different cost environment from an organization with extensive rail contracts, even if both operate in the same broader economy.
The resulting difference in budget exposure may become particularly important when annual agreements are renewed, fuel-adjustment provisions reset, or transportation networks require additional capacity.
Why the Headline Numbers Cannot Be Treated as Freight Quotes
Producer-price indexes measure changes in prices received by domestic producers of goods and services.
They are not the same as truckload spot-market quotations, railroad contract prices, container freight rates, or an individual shipper’s transportation invoices.
This distinction is essential.
A 19.3% year-over-year increase in the truck transportation producer-price index does not mean every shipper’s truckload costs increased 19.3%.
Contract provisions, shipment characteristics, lane geography, fuel programs, operating requirements, carrier mix, and purchasing arrangements all affect actual freight expenditures.
Similarly, the modest increase in the rail index does not prove that rail is universally more economical than trucking.
The two modes serve different shipment profiles and have different terminal, handling, access, equipment, transit-time, and network constraints.
FIR’s interpretation: The indexes are most useful as directional indicators of where to investigate commercial exposure—not as substitutes for shipment-level cost analysis.
The Procurement Risk: One Inflation Assumption for Every Mode
Many transportation budgets are developed using a common escalation factor, particularly when detailed contract information is unavailable or when management requires an early planning estimate.
That approach becomes less reliable when underlying transportation markets diverge substantially.
Consider a manufacturer purchasing truckload transportation, rail service, and ocean freight.
Its final transportation costs depend on the volume assigned to each service, the terms of individual contracts, fuel and accessorial charges, and whether the network can shift shipments between modes without creating additional operational costs.
A uniform inflation adjustment cannot capture those differences.
The relevant calculation is not the average change across published freight indexes.
It is the anticipated spending change for the company’s actual transportation portfolio.
This requires combining shipment forecasts with carrier agreements, expected rate adjustments, routing alternatives, and the operating costs associated with each mode.
It also requires attention to service performance.
Moving freight to a mode with lower apparent price pressure may offer little financial benefit if additional inventory, handling, terminal fees, or longer transit times eliminate the savings.
Five Decisions Shippers Should Reevaluate
1. Segment transportation budgets by actual service category.
Separate truckload, LTL, rail, intermodal, ocean, air freight, parcel, and managed transportation expenditures where the underlying contracts and data support those distinctions. Avoid assigning a single escalation percentage to every transportation purchase.
2. Reconcile price indexes with actual invoices.
Compare changes in contract transportation charges, fuel, accessorials, detention, handling, and other material expenses against the applicable external market indicators. Identify which differences are explained by pricing and which reflect changes in shipment mix or service requirements.
3. Test realistic modal alternatives.
Evaluate truck-to-rail or other modal adjustments only where shipment characteristics, available networks, delivery requirements, inventory economics, and service reliability make substitution commercially feasible.
4. Stress-test fourth-quarter and 2027 transportation budgets.
Develop scenarios reflecting persistent pricing pressure in exposed services, stabilization, and potential further changes. Use documented assumptions rather than treating one monthly index release as a forecast.
5. Establish a regular multimodal pricing review.
Coordinate procurement, transportation operations, finance, and supply-chain planning around a common view of market indexes, contract renewals, shipment forecasts, and actual delivered costs.
These actions can help organizations detect emerging cost exposure before it becomes an unexplained budget variance.
What Freight Executives Should Watch Next
The next several months will help determine whether September’s divergence persists.
Truck transportation bears watching because September’s monthly increase followed an upwardly revised August reading.
Water transportation warrants continued observation because of its substantial year-over-year increase, although developments in specific ocean and inland markets must be evaluated separately.
Rail and air freight also require attention. Relatively subdued producer-price changes do not guarantee abundant capacity, consistent service, or stable future contracts.
The direction of fuel costs, carrier operating expenses, freight demand, equipment availability, and contractual repricing will influence how these producer-price pressures translate into actual shipper expenditures.
FIR will continue evaluating those developments through its Multimodal Rate Monitor and broader transportation intelligence coverage.
The Executive Takeaway
September’s freight producer-price data present a clear warning against treating transportation inflation as one uniform number.
Truck and water freight producer prices rose sharply over the past year. Rail, air freight, and freight arrangement services registered materially different increases.
The resulting divergence creates both risks and potential opportunities for shippers—but only where their purchasing arrangements and transportation networks permit a practical response.
The priority is not to chase the mode with the lowest published index increase. It is to understand which parts of a company’s freight portfolio face the greatest cost exposure, and whether alternative operating decisions genuinely improve total delivered economics.
That is the distinction between monitoring freight inflation and managing it.
Sources and methodology
Primary source: U.S. Bureau of Labor Statistics, Producer Price Indexes—September 2026, released October 15, 2026.
www.bls.gov/news.release/archives/ppi_10152026.htm
Supporting government release: U.S. Department of Labor, September 2026 Producer Price Index release and statistical tables.
www.dol.gov/newsroom/economicdata/ppi_10152026.pdf
Methodology: Year-over-year comparisons use unadjusted producer-price changes. Month-over-month comparisons use seasonally adjusted changes. September readings are preliminary and earlier months may be revised. Freight transportation PPI categories are not interchangeable with commercial spot rates, contracted shipper rates, or carrier-specific price quotations.
Editorial disclosure: Freight Intel Report provides independent transportation intelligence and analysis. The operational recommendations represent FIR’s interpretation of the cited data and are not statements or forecasts issued by the Bureau of Labor Statistics.
Leave a Reply