
A record container month can coexist with softer import demand—and that is exactly why freight planning is unusually difficult right now.
July delivered one of the strongest U.S. container-import months on record. Yet the newest federal trade report shows June goods imports falling in both nominal and inflation-adjusted terms. At the same time, U.S. factories reported faster production, growing backlogs, lean customer inventories and slower supplier deliveries in July.
The evidence does not describe one freight cycle. It describes two: a tariff-driven import peak that has been pulled forward, and a domestic industrial cycle that is gaining momentum.
Update — August 10: The first nationwide actual count for July confirms the early container peak. Descartes Datamyne reports 2.51 million U.S. container-import TEUs, up 4.5% from June. Reuters independently reported that this was the fourth-highest July on record, although volume remained 4.3% below July 2025. China-origin imports rose to 873,129 TEUs—the highest monthly level in a year. The data confirm a concentrated import wave, but they do not by themselves prove stronger end-customer demand or a sustained autumn capacity tightening.
What the latest data actually show
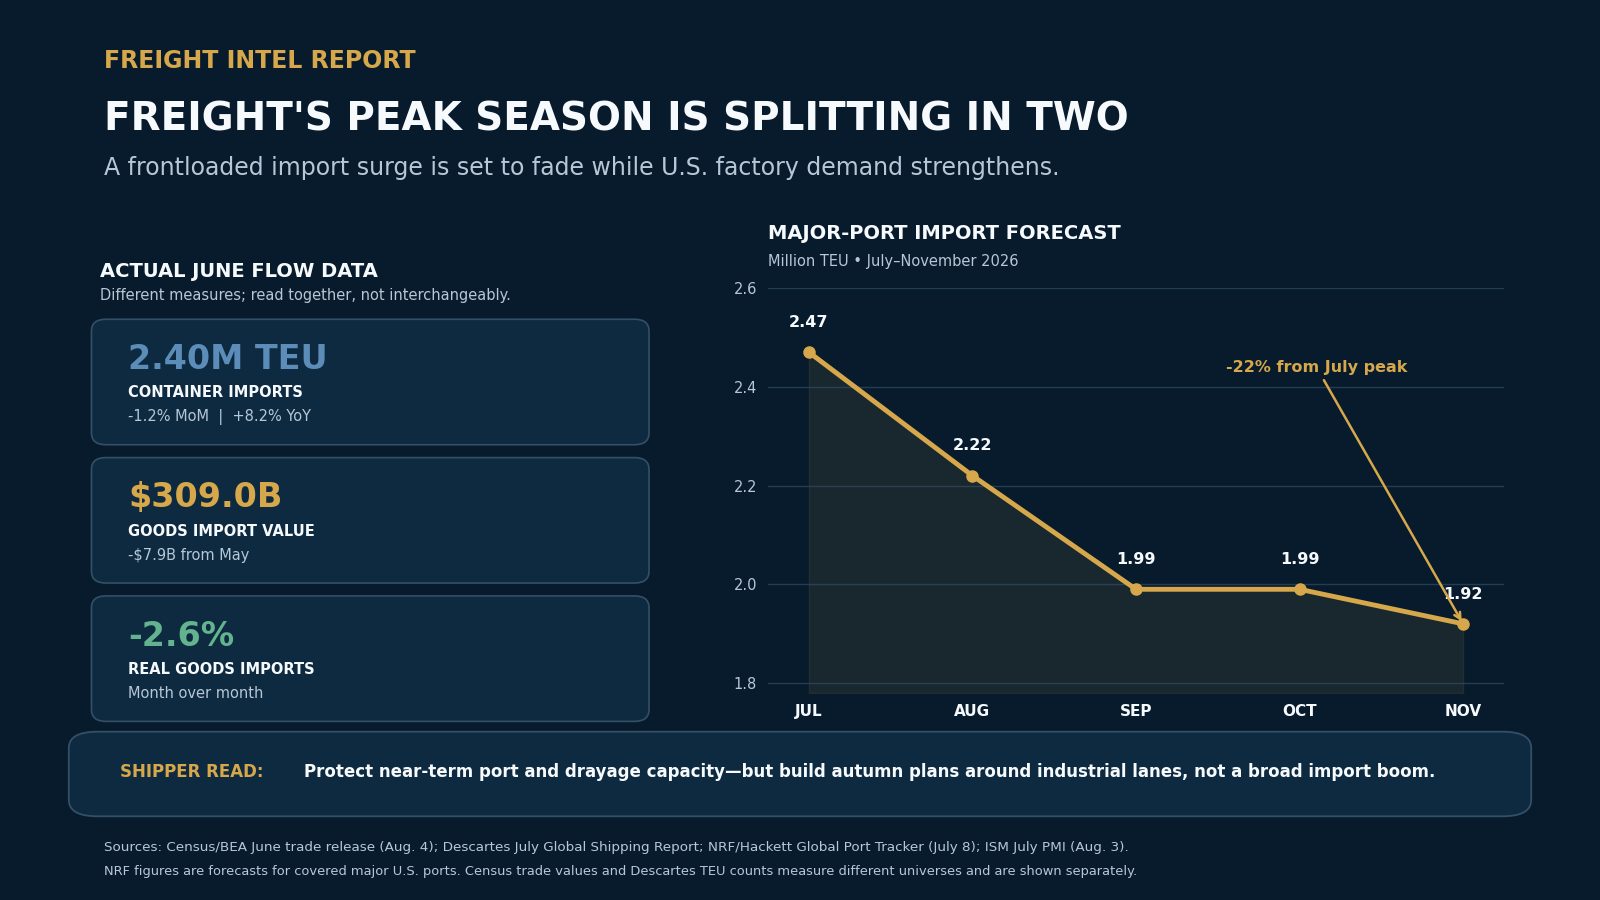
The U.S. Census Bureau and Bureau of Economic Analysis reported on August 4 that total June imports fell 1.8% from May to $388.0 billion. Goods imports declined by $7.9 billion to $309.0 billion, while inflation-adjusted goods imports fell 2.6%.
Container data tell a different—but not contradictory—story. Descartes reported on July 8 that June U.S. containerized imports totaled 2,400,627 TEUs. The August report now puts July at approximately 2.51 million TEUs, a 4.5% monthly increase. Through July, imports remained 0.9% below 2025 even as China-origin volume reached a one-year high.
Those measures should not be treated as interchangeable. Census trade data cover the value of goods across transportation modes and commodity categories. Descartes counts container volume. A container filled with lower-value merchandise and a high-value shipment moving by air can push the two series in opposite directions.
The import peak is real—but it is early and policy-driven
The National Retail Federation and Hackett Associates Global Port Tracker, published July 8, forecast 2.47 million TEUs at the major ports it covers in July. Descartes’ broader nationwide dataset has now confirmed 2.51 million TEUs. The two datasets have different coverage and should not be compared mechanically, but both point to a concentrated July arrival wave.
The NRF forecast then drops to 2.22 million TEUs in August, 1.99 million in September and October, and 1.92 million in November. That is a projected 22% decline from July to November.
The forecast itself moved sharply. On June 8, Global Port Tracker projected July at 2.19 million TEUs. One month later, the estimate had increased by 280,000 TEUs, or nearly 13%, as importers reacted to tariff deadlines and policy uncertainty. The actual July count confirms that the wave arrived; it still does not establish how much reflects durable consumer demand rather than cargo pulled forward from autumn.
Domestic industrial freight is sending a stronger signal
The Institute for Supply Management’s July report, published August 3, showed the Manufacturing PMI rising to 55.6, its highest reading since May 2022. Production climbed to 58.5, the strongest level since November 2021. Backlogs rose to 55.0, new export orders returned to growth at 53.0, and manufacturing employment expanded for the first time in 33 months.
Two details matter for transportation planning. Customers’ inventories fell further into “too low” territory at 40.7, while supplier deliveries slowed at an index reading of 58.9. Together, those measures suggest replenishment needs and supply constraints could support freight even after the imported-container peak passes.
Rail data provide partial hard-data confirmation. The Association of American Railroads’ July economic review said average weekly intermodal volume reached a monthly record in June, while carload growth extended to a sixth consecutive month. For the week ending July 18, U.S. intermodal volume was 7.2% above the prior year, and year-to-date intermodal traffic was up 3.8%.
What it means by mode
Ocean, ports and drayage
Near-term capacity deserves protection through the July arrival wave and its inland handoff. But importers should not automatically extend July assumptions into autumn. The latest major-port forecast implies a materially softer September-November environment unless new tariff, inventory or consumer-demand developments create another pull-forward.
Intermodal rail
Intermodal can benefit from both sides of the split: elevated international container arrivals now and a broader conversion opportunity if industrial freight grows while truck capacity remains disciplined. The risk is geographic. Port-origin lanes may cool after the frontload, while domestic industrial corridors remain active.
Truckload, LTL and brokerage
National averages may conceal the most important change. Retail-import lanes can loosen while machinery, metals, food, transportation equipment and electronics lanes strengthen. Carriers and brokers should forecast by commodity, origin and customer inventory position—not extrapolate one peak-season index across the network.
Warehousing and fulfillment
Frontloaded imports do not disappear when they clear the port. They shift into storage, allocation and final-mile networks. Shippers that accelerated inbound inventory should stress-test warehouse labor, detention exposure, dwell time and inventory carrying cost even if ocean bookings ease later in the quarter.
Four actions for decision-makers
- Separate timing freight from demand freight. Label purchase orders and loads as tariff frontloads, seasonal replenishment, recurring production or true incremental demand. Each requires a different capacity assumption.
- Use trigger-based capacity commitments. Protect port, drayage and transload capacity around confirmed arrivals, but make autumn commitments responsive to actual port throughput, retail sales and inventory data.
- Reprice by lane and commodity. Industrial corridors tied to machinery, metals, food, electronics and transportation equipment may behave differently from retail-import lanes. Contract and spot strategies should reflect that divergence.
- Track confirmation, not headlines. Watch terminal-level July throughput, August ocean bookings, weekly rail intermodal traffic, ISM backlogs, Census inventories and hard shipment indexes before declaring either a freight boom or a post-peak collapse.
What remains uncertain
National July container volume is now confirmed, but terminal-level totals, port transit performance and August booking data are still incomplete. The ISM report is a directional survey rather than a shipment count. Trade values can move with prices and commodity mix. Retail inventories, Cass shipment data and finalized port statistics will determine whether stronger factory sentiment becomes a broad freight-volume expansion.
Freight Intel takeaway: The immediate market is not simply tightening or loosening. Import logistics face a concentrated frontloaded peak, while domestic industrial freight may retain momentum beyond it. The winning strategy is to split capacity, pricing and inventory decisions along those two demand paths.
Discussion prompt: Are your autumn transportation plans still built around a traditional retail peak—or have domestic industrial lanes become the larger capacity risk?
Subscribe free to Freight Intel Report for source-backed market signals, regulatory analysis and practical shipper actions—without manufactured urgency or paywall-first reporting.
Sources and data dates: Descartes Datamyne, August 2026 Global Shipping Report, updated August 10, 2026; Reuters coverage of the July Descartes data, published August 10, 2026; U.S. Census Bureau and Bureau of Economic Analysis, U.S. International Trade in Goods and Services, June 2026, published August 4, 2026; Descartes Datamyne, July Global Shipping Report, published July 8, 2026; National Retail Federation/Hackett Associates, Global Port Tracker, published July 8, 2026, and prior forecast published June 8, 2026; Institute for Supply Management, July 2026 Manufacturing PMI, published August 3, 2026; Association of American Railroads, July 2026 Rail Industry Overview and weekly traffic for July 18.
Government services: For government services, verification, registrations, forms, reporting, or instructions, always navigate to the official agency website directly. Independently verify its address before entering credentials or business information.
Leave a Reply