
SHIPPER STRATEGY · QUICK REFERENCE GUIDE
A quick reference to finding profitable lanes, negotiating the full price, and keeping freight savings from disappearing into delays and extra charges.
Freight Intel Report · Sources and calculations reviewed October 8, 2026
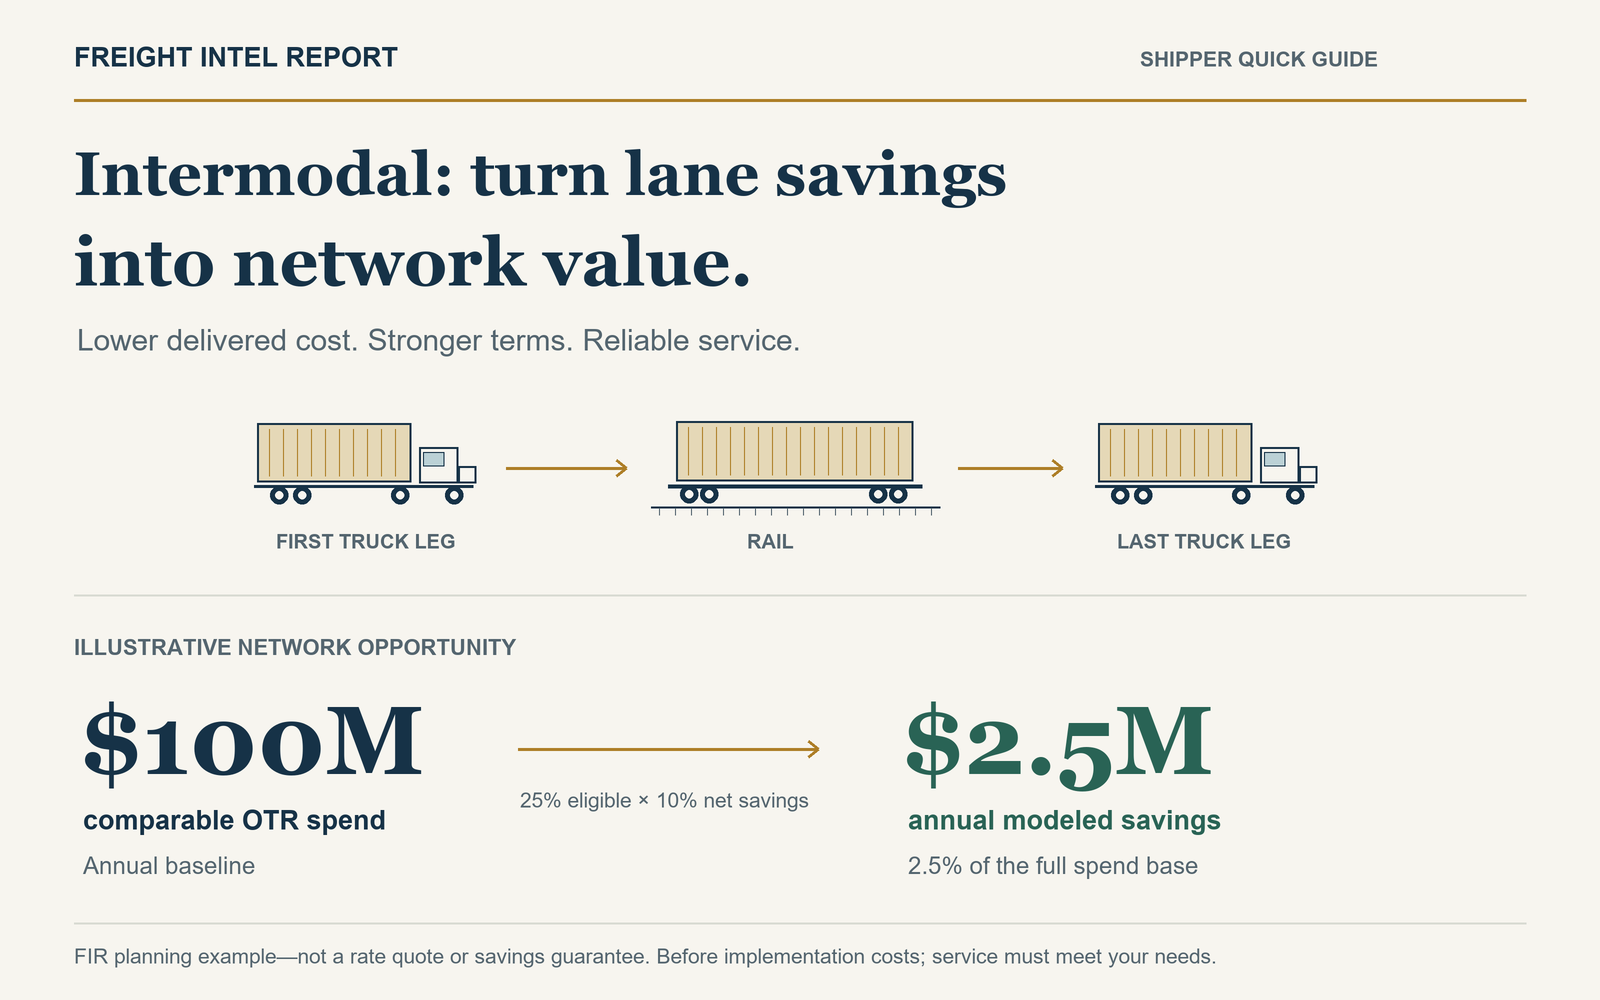
The intermodal opportunity is a purchasing and network decision: lower delivered cost without creating a more expensive service problem. For a shipper with $100 million in comparable annual OTR spend, converting an eligible 25% at a repeatable 10% net saving would produce $2.5 million in annual savings before implementation costs. Those figures are a planning illustration, not a rate benchmark or forecast. The same calculation works for a single lane or a national distribution network.
This quick reference shows how to find eligible freight, request comparable bids, negotiate the full charge basket and validate the outcome. It also explains how brokers, carriers, railroads, ocean providers and warehouse operators can improve account economics and strengthen shipper relationships. The main operating examples concern U.S. domestic truck–rail container shipping; imports and other modes require their own equipment, booking and charge checks.
For suitable freight, intermodal can reduce transportation expense, expand access to capacity and lower emissions. For an unsuitable lane, it can add terminal waiting, inventory expense and delivery uncertainty. The goal is to identify which loads benefit from rail’s long-distance efficiency while retaining trucking where speed, flexibility or direct handling matters more.
What intermodal means—and what you are actually buying
Intermodal moves a container or trailer by more than one transportation mode. In a typical domestic truck–rail move, a truck takes the loaded container to a rail terminal, a train carries it between terminals, and another truck completes delivery. Those first and last truck legs are called drayage. The terminal is often called a ramp. The chassis is the wheeled frame used to carry the container on the road. [1]
The cargo normally stays inside the same unit during a truck–rail transfer. Transloading is different: the goods are unloaded and reloaded into another container, trailer or railcar. An import may travel in an ocean container all the way inland, or be transloaded near the port into domestic equipment. Count the added handling, damage exposure and cost when comparing those options.
You can buy door-to-door service from an intermodal marketing company (IMC), carrier or qualified broker, or arrange the rail and truck components separately. A single invoice can simplify administration; it does not automatically establish who owns every operational failure. Confirm the responsible contracting party, equipment provider, actual rail route and drayage arrangements. Union Pacific, for example, offers both ramp-to-ramp and door-to-door options. [2]
Why reconsider the mode mix now?
Fuel exposure makes the review timely. EIA’s U.S. retail on-highway diesel average was $6.199 per gallon on October 5, 2026, compared with $5.599 on August 31. That is a 10.7% increase in five weeks, calculated from EIA’s weekly figures. The October 5 price was also 5.1% below the September 21 reading of $6.529. Both directions matter: fuel formulas should respond to declines as well as increases. These are retail benchmarks, not the fuel price every carrier pays or a prediction of freight-rate changes. [3]
Rail demand is substantial, too. AAR reported that U.S. railroads averaged nearly 297,000 intermodal containers and trailers per week in August 2026, up 4.4% year over year. That aggregate combines domestic and international intermodal traffic. It demonstrates use of the network; it does not prove spare equipment or dependable service on your particular lane. [4]
J.B. Hunt’s second-quarter 2026 results illustrate another important distinction. Its intermodal load volume rose 10%, gross revenue per load rose 11%, and revenue per load excluding fuel surcharges rose only 1%. The company attributed the gross change to fuel, customer rates and freight mix. These are one provider’s results, not a marketwide rate index. A buyer should therefore separate fuel and mix effects before treating a revenue increase as an equivalent base-rate increase. [5]
The practical case for other modes is broader than today’s diesel price. Qualifying an alternative before a disruption gives procurement a usable option when OTR capacity, weather or a supplier’s service changes. However, truck–rail still depends on trucks, terminals and equipment. Two providers using the same railway and ramps may share much of the same disruption risk.
When intermodal deserves a serious bid
EPA’s intermodal guidance identifies movements over 500 miles as attractive candidates; its 2019 shipper guidance also discusses regional corridors of 500–1,500 miles. These are general planning references, not current lane quotes or universal break-even distances. [6] [7]
| Factor | Stronger candidate | Reason to retain OTR or investigate further |
|---|---|---|
| Distance and geography | Long linehaul with practical terminal access at both ends | Short move, long drays, out-of-route rail routing or an inconvenient interchange |
| Timing | Planned replenishment with a delivery window that fits observed transit | Stockout recovery, same-day demand or a missed appointment that stops production |
| Volume | Repeat loads with usable forecasts and predictable loading days | Highly irregular releases or large last-minute swings without agreed capacity |
| Cargo | Freight that fits approved equipment and can be secured for rail movement | Unsupported temperature requirements, incompatible dimensions, weight distribution or commodity restrictions |
| Facilities | Loading and receiving hours aligned with cutoffs and container availability | A receiver unable to unload before equipment or terminal free time expires |
| Economics | Positive net savings after time, handling and service risk | A discount that disappears under a plausible delay or accessorial scenario |
Intermodal can serve both large contracted networks and individual loads purchased through an appropriate provider. Consistency helps pricing and planning, but owning containers or tendering a trainload is not a prerequisite. Temperature-controlled and premium services also exist. BNSF lists expedited, standard and temperature-controlled options; obtain the exact lane offering rather than assuming all intermodal freight must be dry and nonurgent. [8]
The pros—and the costs of getting the fit wrong
Cost and capacity: rail can move many loads together over the long leg, while local trucks serve the ends. That can create attractive economics and another capacity channel. But the rail quote does not eliminate drayage expense, terminal congestion, empty repositioning or equipment shortages. An available OTR backhaul rate can sometimes offer a lower delivered cost than intermodal.
Handling and security: leaving freight sealed in a container avoids unloading it at each modal transfer. Nevertheless, lifting the unit does not eliminate vibration, cargo shift, seal violations or theft risk. Treat loading standards and a verified chain of custody as operating requirements. Union Pacific’s guidance includes blocking and bracing, axle-weight distribution, seals and high-value protection. [9]
Emissions: rail’s efficiency can support lower freight emissions. EPA’s older general guidance describes freight-train greenhouse-gas emissions per ton-mile as about two-thirds below a typical truck’s. That comparison is neither a door-to-door guarantee nor a 2026 shipment-specific measurement. Include both drays, actual rail distance, payload, equipment and empty movements in your estimate; use current carrier data and a consistent boundary. EPA SmartWay provides shipper tools and carrier performance data. [6] [10]
For EPA SmartWay tools or partner services, navigate directly to EPA’s official website and independently verify its address before entering credentials or business information.
Transit and flexibility: scheduled departures can support repeatable planning. The tradeoff is a sequence of cutoffs, train movements, terminal availability and delivery appointments. A missed cutoff can add a departure cycle. A container arriving at the destination ramp has not yet arrived at your dock.
Buy the delivery window, not a rail-speed statistic
BNSF’s FAQ describes average expedited service of about 800 miles per day and standard service of about 600 miles per day. Those figures are useful orientation, not a pickup-to-delivery promise. Do not divide highway mileage by one of them and call the result your transit commitment. [11]
Request a complete timeline: empty equipment delivered, freight ready, pickup, gate cutoff, departure, any rail interchange, destination availability, outgate and receiving appointment. Ask for recent lane-specific results by departure day and service class, with holiday and peak-period exceptions. Define whether “on time” means ramp availability, delivery appointment arrival or completed unloading.
Ask for the median and the 90th-percentile transit: the time within which 90% of comparable loads arrived. If the median is four days but the 90th percentile is six, a four-day inventory plan leaves meaningful exposure. Those days are an example, not an industry transit standard. For especially consequential deliveries, examine the 95th percentile and worst observed events as well.
Ask how many comparable shipments support those results and whether the sample includes missed departures, cancellations, rejected tenders and recovery moves. Transit statistics for successfully completed rail loads alone can hide the cost of freight that had to be rescued by truck. Track tender acceptance separately from delivery performance, and include rescue spending in the purchasing comparison.
Premium service can change the fit. J.B. Hunt advertises more than 95% on-time delivery for its Quantum offering. Treat that as a provider claim to test against your lane, delivery definition and contract—not a reliability figure for all intermodal. [12]
What does a 25% quote discount really save?
The following is a FIR planning example, not a market quote or a forecast. Assume comparable shipment quantities, a $3,600 OTR price and a $2,700 intermodal price. Both include their respective linehaul, fuel and normal delivery; the intermodal price also includes both drays and ordinary equipment charges. Avoid counting those components again.
| Item | OTR baseline | Intermodal alternative |
|---|---|---|
| Comparable transportation quote | $3,600 | $2,700 |
| Extra inventory carrying cost | Baseline | $110 |
| Extra loading/securement expense | Baseline | $80 |
| Incremental expected service-recovery cost | Baseline | $100 |
| Comparable decision cost | $3,600 | $2,990 |
| Net advantage over OTR | — | $610 · 16.9% |
The transportation discount is $900, or 25% of the OTR quote. After $290 of incremental business costs, the modeled saving is $610, or 16.9%. Common inventory and operating costs already present in both alternatives are excluded. The $610 gap is the headroom above the modeled total before it reaches OTR parity. When assessing an actual disruption, first replace the $100 expected-risk allowance with the realized costs; do not stack both on the same event.
The $110 inventory allowance comes from $100,000 of cargo × 20% annual carrying cost × two additional days ÷ 365 = $109.59, rounded. Use your finance team’s carrying rate and valuation basis. Extra pipeline inventory is not the same as extra safety stock: transit variability may require a separate buffer, which this example does not include.
The $100 recovery allowance assumes an incremental 5% chance of a $2,000 service consequence relative to OTR. Both are hypothetical inputs. Include lost sales, customer penalties or production impact only where they are credible and measurable; a severe disruption may be unacceptable regardless of its expected average cost.
Now stress-test a troubled shipment. Replace the $100 expected allowance with $450 of terminal/equipment charges and $350 of actual recovery expense. Cost becomes $3,690: $2,700 + $110 + $80 + $450 + $350. The alternative is then $90 more expensive than OTR. Do not add the expected allowance to the same realized event and count it twice.
At 40 converted loads per month, $610 per load would imply $292,800 per year, assuming 480 loads, unchanged volume and repeatable net savings. Deduct implementation, systems and any additional staffing expense before treating that figure as a budget benefit. That is a scenario, not a budget commitment. If only 25% of a portfolio’s comparable OTR spend qualifies, a 16.9% saving on that portion produces about 4.2% savings across the portfolio before implementation costs. A lane discount is not a whole-network discount.
Scale lane savings into a network business case
A favorable lane does not justify a blanket conversion target. Group freight by origin–destination pair, direction, service requirement, cargo, departure day and equipment. Identify the spend actually eligible for conversion, then test savings against a contemporaneous OTR alternative. A strong outbound rate can coexist with an unfavorable return direction; do not blend them until the shipment mix is explicit.
Annual network benefit = eligible baseline spend × repeatable net savings rate − implementation and ongoing incremental costs. In the $100 million example, 25% eligibility means $25 million is addressable; a 10% net saving on that portion yields $2.5 million, or 2.5% of the original network spend. It does not reduce the full network by 10%. If only 15% is eligible and net savings average 6%, the benefit is $900,000, or 0.9%, before implementation costs. These are separate hypothetical scenarios.
For an enterprise award, compare expected savings with systems integration, warehouse changes, extra safety stock, contract minimums and management effort. Separate recurring expense from one-time investment. Finance should validate carrying-cost inputs and distinguish reduced freight expense from a change in working capital; neither automatically equals additional profit or immediately available cash. Require the proposal to identify which costs are already in the quote and which fall to the shipper.
Protect the capacity behind the award. Define equipment access, tender lead time, accepted volume bands, peak-period allocation and recovery responsibility. Confirm that fallback suppliers have usable capacity and a distinct route or mode where continuity matters. Multiple contracts on the same railway do not necessarily create independent recovery options.
Use a monthly lane scorecard and a quarterly business review to reconcile booked rates with delivered invoices, service failures and the original savings case. Establish a review trigger for repeated missed appointments, unavailable equipment, unexpected charges or deteriorating net savings. Expand, renegotiate or withdraw the lane based on the agreed evidence.
How to evaluate the bid
Give competing providers the same lane file: postal codes and facilities, loading days, weekly volume and seasonality, commodity, dimensions, gross cargo weight, pallet count, cargo value, temperature requirements, loading method and required delivery windows. State whether you need live loading, drop equipment, multiple stops, customs coordination or transloading.
Obtain at least two genuinely workable intermodal proposals and a comparable OTR alternative where possible. Compare the same service class, equipment, direction, time period and shipment quantity. Identify when competing bids share the same railroad, terminal or drayage subcontractor.
Require a written inclusion/exclusion sheet covering:
- Base transport: each dray, rail linehaul, lifts, chassis, fuel and equipment positioning. Verify whether the price is door-to-door or ramp-to-ramp.
- Fuel: index, geography, base or trigger, calculation, reset frequency and lag. Identify whether separate rail and dray surcharges apply.
- Time-related charges: truck waiting, rail storage, container detention/per diem, chassis days and any separate depot charge.
- Exceptions: pre-pull, redelivery, overweight handling, extra stops, weekend service, exams, transload, cancellation and rescue.
- Commercial terms: rate validity, peak surcharges, minimum-volume obligations, capacity commitments, payment terms, cargo liability, exclusions and claims deadlines.
For each clock, identify the start event, last free time, charge increments, calendar versus business days, weekends and holidays, and the party receiving the notification. Terminal storage, container use and driver waiting are different charges; one free-time allowance may not cover the others. BNSF explains that terminal storage runs from availability notification to outgate, with charges after free time. Its current rules are maintained in the customer portal, so obtain the applicable version with the bid. [13] [14]
Negotiate value the provider can actually deliver
Trade useful consistency for a better package. Offer accurate forecasts, agreed tender lead time, flexible loading windows, fast unloads and a realistic baseline of weekly loads. Ask the provider to price each concession separately. A predictable Tuesday shipment can have different economics from an unforecast Friday rush; do not assume both deserve the same discount.
Negotiate the complete charge basket. A modest linehaul reduction can be less valuable than additional free time, a lower detention tier or included pre-pull capacity. Conversely, paying for unused allowances wastes money. Use actual facility dwell and receiver hours to identify the concessions with the highest value.
Make fuel auditable. Request worked invoices at the current benchmark and at a benchmark $1 per gallon lower and higher. That sensitivity test does not predict fuel prices. It reveals whether the formula is transparent, whether it works in both directions and whether the same cost is being charged twice.
Tie commitments together. If a supplier asks for volume guarantees, define its capacity obligation, tender acceptance, service measurement and remedies. Include reasonable forecast bands, seasonal adjustments and an exit or review process if agreed service deteriorates. A published schedule and a promised rate alone do not reserve equipment.
Agree exception ownership before the first load. Set escalation contacts, notice deadlines, approvals for recoveries, spending authority and accessorial evidence. Require timestamps and the applicable charge rule. Decide who can authorize a switch to trucking and at what projected service risk. Service credits should not be mistaken for complete compensation for a stockout.
Compare annualized net cost, not the lowest opening number. Use the same shipment basket, repeat the fuel and delay scenarios, and include implementation expense. Negotiate with evidence about turns, forecasts and handling rather than unsupported claims that every intermodal lane should save a fixed percentage.
Turn an operational concession into a dollar decision. In a separate hypothetical bid, an extra day of free time costs $35 per load and avoids a $150 charge on 30% of loads. Its expected avoided charge is $45 per load, leaving a $10 advantage before other effects. If only 10% of loads would incur the charge, the avoided cost is $15 and the $35 concession is poor value. Use the actual charge tier, facility history and provider’s written terms; do not pay for free time merely because it sounds protective.
Dos and don’ts before dispatch
| Do | Don’t |
|---|---|
| Get the approved load plan, payload and axle-distribution limits for the exact equipment and road legs. | Assume a 53-foot container carries the same cargo weight or usable cube as every 53-foot OTR trailer. |
| Block, brace and document the load; photograph condition, seal and container number. | Reuse an OTR loading pattern without confirming rail securement requirements. |
| Verify commodity acceptance, insurance, liability limits and any high-value or temperature protocols. | Assume all cargo, equipment or reefer services are accepted on every route. |
| Align the receiver appointment with actual availability and the last free day; assign a backup notification contact. | Wait for a storage invoice to discover that a container was available over the weekend. |
| Validate carrier identity, dispatch instructions and changes to pickup or destination. | Accept an unexpected reroute or substitution solely from an unverified email. |
| Track pickup, ingate, departure, availability, outgate, delivery and empty return. | Treat train arrival or a tracking dot as proof of delivered freight. |
Before launch, assign an owner and backup for each handoff: the shipping dock owns freight readiness and the approved load plan; the coordinating provider owns milestone monitoring and escalation; the drayage carrier confirms gate and appointment execution; the receiving facility confirms unloading capacity; and an assigned party confirms the empty-return location and completion. Write the allocation into the operating plan and align it with the contracts. Operational coordination does not override liability terms.
For imports: compare intact ocean containers with transloading
An intact ocean-container rail move can reduce handling and avoid a truck transfer between the port and an off-dock ramp where on-dock service is available. The Port of Los Angeles describes a network of on-dock and near-dock rail facilities connected to inland markets. Availability depends on terminal, carrier, destination and booking. [15]
Transloading can support inland consolidation, sorting to multiple destinations and earlier release of ocean equipment. It also introduces labor, warehouse capacity, handling and scheduling requirements. J.B. Hunt lists transloading as a means of consolidating cargo and reducing port dwell and equipment expense; those are potential benefits, not automatic savings. [16]
Ask for two complete proposals using your packing list: intact-container inland delivery, and port dray plus transload plus inland delivery. Show how many outbound loads are required. Do not assume a universal conversion ratio between 40-foot ocean boxes and 53-foot domestic containers; dimensions, cargo density, pallet geometry, weight limits and segregation determine the answer.
Track customs and carrier release, rail readiness, inland availability, delivery and empty return. Keep separate records for marine-terminal charges, ocean equipment charges, rail storage and drayage waiting. FMC’s maritime detention-and-demurrage rules do not create a universal free-time entitlement for standalone domestic rail shipments.
For maritime billing, use current guidance. FMC states that a court set aside the rule’s section identifying permitted invoice recipients, while the remaining invoice-information and timing provisions continue to apply. A 2026 court decision also upheld an FMC finding that charges during a particular port closure were unreasonable. Preserve evidence of closures, equipment availability, appointments and return attempts; the outcome depends on the applicable rule and facts, rather than a blanket assumption that every disputed fee disappears. [17] [18]
Under the current maritime billing rules, ocean common carriers and marine terminal operators generally must issue these invoices within 30 calendar days after the charge was last incurred; non-vessel-operating common carriers (NVOCCs) have a separate 30-day clock running from the issuance date of the invoice they received, not the day it reached their inbox. Billed parties must have at least 30 calendar days from invoice issuance to request mitigation, refund or waiver. Calendar those dates and retain the supporting documents. [19]
How transportation providers can strengthen shipper relationships
Brokers and IMCs: lead with a lane-specific comparison that makes your own recommendation testable. Show the route, service class, cargo fit, price inclusions and exception owner. Disclose when alternative offers use the same underlying network. Recommend OTR when the business deadline outweighs rail economics; that decision can build more confidence than forcing every shipment into the mode you sell.
Motor carriers and drayage operators: position local capacity, appointment execution and recovery capability as part of the shipper’s complete transportation plan. Quote chassis and waiting rules clearly. Feed realistic gate and dock cycle times back to the buyer, document delays and propose changes that increase productive turns. Combine contracted dray work with a defined OTR backup where it suits your equipment and network.
Railroads: make lane schedules, cutoff changes, interchange responsibilities and availability information easy for customers to use. Share actual performance by lane and departure day, including the slower transit range. Coordinate with drayage partners and IMCs on peak equipment needs and disruptive events. A train-speed improvement matters to the shipper only if it improves delivery or inventory performance.
Ocean carriers, ports and forwarders: coordinate vessel arrival, releases, rail loading and equipment return as one plan. Offer intact-container and transload alternatives using the same cargo and destination assumptions. Give customers timely visibility into each fee clock and realistic pickup opportunities, rather than leaving them to reconcile conflicting last-free-day information.
Warehouses, transload operators and other transportation companies: publish usable handling capacity, loading standards and appointment windows. Explain how sorting, consolidation, barge, carload rail, LTL or regional distribution would change the shipment—not just the freight rate. Bulk or oversized freight may fit a different rail or water service better than container intermodal. Air or expedited trucking may serve the small urgent portion while the planned replenishment flow moves by a lower-cost mode.
For providers, protect contribution as well as revenue. A lower selling rate can still support a sound account if reliable forecasts, faster equipment turns and fewer rescue moves reduce the cost to serve. Measure revenue less the relevant purchased transportation, labor, equipment and recovery costs for the lane; identify which costs are already included to avoid double counting. Price special handling and reserved capacity explicitly. Build retention through documented shipper savings and dependable execution rather than relying on surprise accessorials to repair an underpriced bid.
The shared relationship advantage is credible coordination: one agreed delivery requirement, transparent charges, prompt exception notice and a measurable result.
A pilot that leads to a purchasing decision
FIR recommends starting with a small set of repeat lanes and a four-to-six-week pilot, long enough to observe several departure days and normal receiving patterns. This is a starting plan, not an industry standard or a sufficient statistical sample for rare disruptions. Include a tougher operating week if possible and continue measurement through a peak period before making broad commitments.
Record net cost per delivered shipment and per comparable pallet or unit; tender acceptance; door-to-door transit; appointment performance; terminal and equipment dwell; claims; and exception recovery. Compare with a contemporaneous OTR baseline. Separate shipper, receiver and provider causes, while still counting the total cost the business experiences.
Agree the decision rules before tendering. One illustrative lane might require at least 10% net savings, delivery performance no worse than the shipper’s accepted OTR baseline, and acceptable cargo condition. A critical production lane may require materially tighter service or remain OTR regardless of savings. Twenty successful pilot loads do not prove 99% long-run reliability.
Expand only where the measured service and stress-tested economics support it. Retain enough qualified alternatives to cover urgent demand and plausible disruptions. There is no defensible universal rule that every shipper should shift 20%, 30% or half its freight to intermodal.
Keep the decision record with the award: use the downloadable FIR shipper selection guide to document lane gates, comparable costs, negotiation terms, service thresholds and the final pilot decision.
How to position the business going forward
Shippers should start with procurement, operations and finance reviewing their recent lane spend together. Shortlist repeat loads with a credible delivery buffer, obtain comparable bids, and assign owners for the pilot and invoice audit. Divide freight by its job: predictable replenishment, flexible seasonal builds, service-sensitive deliveries and urgent recovery. Bid intermodal for the suitable flows, protect the time-critical ones, and fund enough visibility and receiving discipline to realize the savings. Keep a tested alternative route or mode where continuity matters.
Providers should sell a better decision and a dependable handoff. The useful offer is a documented improvement in delivered cost, service or capacity flexibility. When the facts favor trucking, say so. When rail can improve the economics, show the full move and explain exactly what the shipper must do to make it work.
Intermodal earns a place in the routing guide when its total cost advantage survives the operating realities. Buying by lane, shipment purpose and delivery requirement gives shippers a practical way to capture that advantage while preserving the speed and flexibility they still need.
Sources and data notes
Primary government, industry-association, port and provider sources, rechecked October 8, 2026. Provider claims are identified in the article. All cost scenarios and pilot thresholds are FIR illustrations or recommendations.
- IANA — What Is Intermodal?Definition; distinguish transfer of a unit from transloading cargo.
- Union Pacific — Domestic IntermodalEquipment and ramp-to-ramp/door-to-door options; provider-specific.
- EIA — Weekly Retail Diesel Prices; October 5, 2026 data, released October 6US $6.199 Oct 5; $5.599 Aug 31; $6.529 Sept 21. FIR calculations +10.7% and −5.1%. Retail benchmark, not carrier purchase costs.
- AAR — Rail Industry Overview; August 2026Nearly 297,000 US intermodal units/week; +4.4% year over year. Domestic and international combined; industry association.
- J.B. Hunt — Second-quarter 2026 results; July 15, 2026Intermodal loads +10%; gross revenue/load +11%; ex-fuel revenue/load +1%. One provider, includes mix effects; not a market rate index.
- EPA — Intermodal Shipping; EPA-420-F09-039, 2009General 500-mile screening reference and historical freight-train ton-mile emissions comparison. Not a current lane savings/emissions guarantee.
- EPA — Intermodal for Shippers; EPA-420-F-19-013, March 2019Historical general guidance including 500–1,500-mile corridors; not 2026 market data.
- BNSF — Intermodal Service Options & DetailsStandard, expedited and temperature-controlled capabilities; availability depends on lane.
- Union Pacific — Intermodal Shipment Quality GuidelinesBlocking/bracing, axle distribution, seals, high-value protection and restricted cargo; request current equipment-specific instructions.
- EPA — SmartWay Shipper Partner Tools and ResourcesUse current carrier data and consistent emissions boundary; no assumed shipment-specific reduction.
- BNSF — Intermodal FAQProvider averages about 800 miles/day expedited and 600 standard. Not a door-to-door commitment.
- J.B. Hunt — Intermodal / QuantumAdvertised more than 95% on-time delivery. Marketing claim for particular service; not universal or independently validated for customer lane.
- BNSF — Driver/Dispatcher ServicesNotification-to-outgate storage clock. Legacy public charge table dated 2018 deliberately NOT reused as current tariff.
- BNSF — Intermodal Rules and Policies Guide Update; June 20, 2024Rules moved to customer portal. Applicable tariffs, free time and limits must be supplied with actual quote.
- Port of Los Angeles — Rail / On-Dock and Near-Dock RailActual port facilities/network. Avoid extrapolating port-wide shares to individual import shipment.
- J.B. Hunt — Transloading ServicesPotential consolidation/dwell benefits; provider description, not guaranteed savings.
- FMC — Court decision on demurrage/detention billing; November 20, 2025Section 541.4 set aside Sept 23, 2025; remaining rules continue. Verified against current eCFR.
- FMC — Court upholds freight-fluidity decision; July 8, 2026Specific port-closure case; do not generalize to automatic relief for all charges.
- eCFR — 46 CFR Part 541; current through October 6, 2026Scope, section 541.4 reserved, invoice contents, 30-day issuance and dispute-request clocks; NVOCC timing distinction.
Leave a Reply