
A year-end planning guide for supply-chain and transportation leaders: defend the budget, secure the deliveries that matter and build a network that can adapt through 2027.
By Eric Bratton, Founder and Executive Editor, Freight Intel Report
October 9, 2026
A food distributor protecting replenishment, a healthcare supplier protecting a critical delivery and a retailer protecting a customer promise face the same budget question: which transportation spending prevents a real business loss—and which spending merely carries forward an old operating habit?
The distinction matters as companies close 2026 and commit to 2027. The most expensive mistake may be assuming that one market forecast can describe the entire transportation network.
A shipper could pay less for diesel in 2027 and still pay more for truck capacity. An ocean shipment could arrive at a quieter gateway and still miss its receiving appointment. A parcel contract could retain its discount while new minimums, fees and zone classifications increase the invoice.
These are different exposures. They need different budget assumptions—and different operating responses.
For the remainder of 2026, transportation decision-makers should concentrate on protecting service where a failure would materially hurt the business. For 2027, they should build a network that can absorb both cost relief and renewed disruption without requiring another emergency procurement cycle.
The objective is neither to lock every rate nor to leave every shipment exposed. It is to know which capacity must be committed, which costs can move and which alternatives have actually been tested.
The evidence points to an uneven market
The latest releases offer four useful planning signals:
| Signal | Verified observation or published forecast | What it means for planning |
|---|---|---|
| Fuel | EIA’s October 6 outlook projects U.S. retail diesel averaging $4.49 a gallon in 2027, versus $5.19 in 2026. It expects prices above $6 this October. | Model potential relief separately from linehaul. Annual averages do not describe January prices or every region. |
| Truck capacity | C.H. Robinson’s October report says routing-guide failures recently rose above 6% in its managed customer portfolio. | Test awarded capacity against actual tender acceptance. This is a portfolio signal, not a national rejection rate. |
| Air cargo | IATA reports August global cargo demand up 4.4% year over year while available capacity fell 0.1%. | Treat air recovery as a service that needs advance qualification, not unlimited emergency capacity. |
| Imports | Descartes reports record September imports but only 0.8% cumulative growth through September; gateways moved differently. | Plan from the company’s orders, origins and destinations rather than assuming a uniform demand boom. |
None of these indicators supplies an executable quote. Together, they argue for a budget built around shipment characteristics and the cost of failing to deliver.
Build a cost bridge, not a blanket increase
Start with a forecast of physical activity: orders, units, pallets, weight, containers, miles and required delivery dates. Higher sales dollars do not necessarily mean more freight, and fewer shipments do not necessarily mean less expense.
Then reconcile the 2026 actual cost to the 2027 plan in separate components:
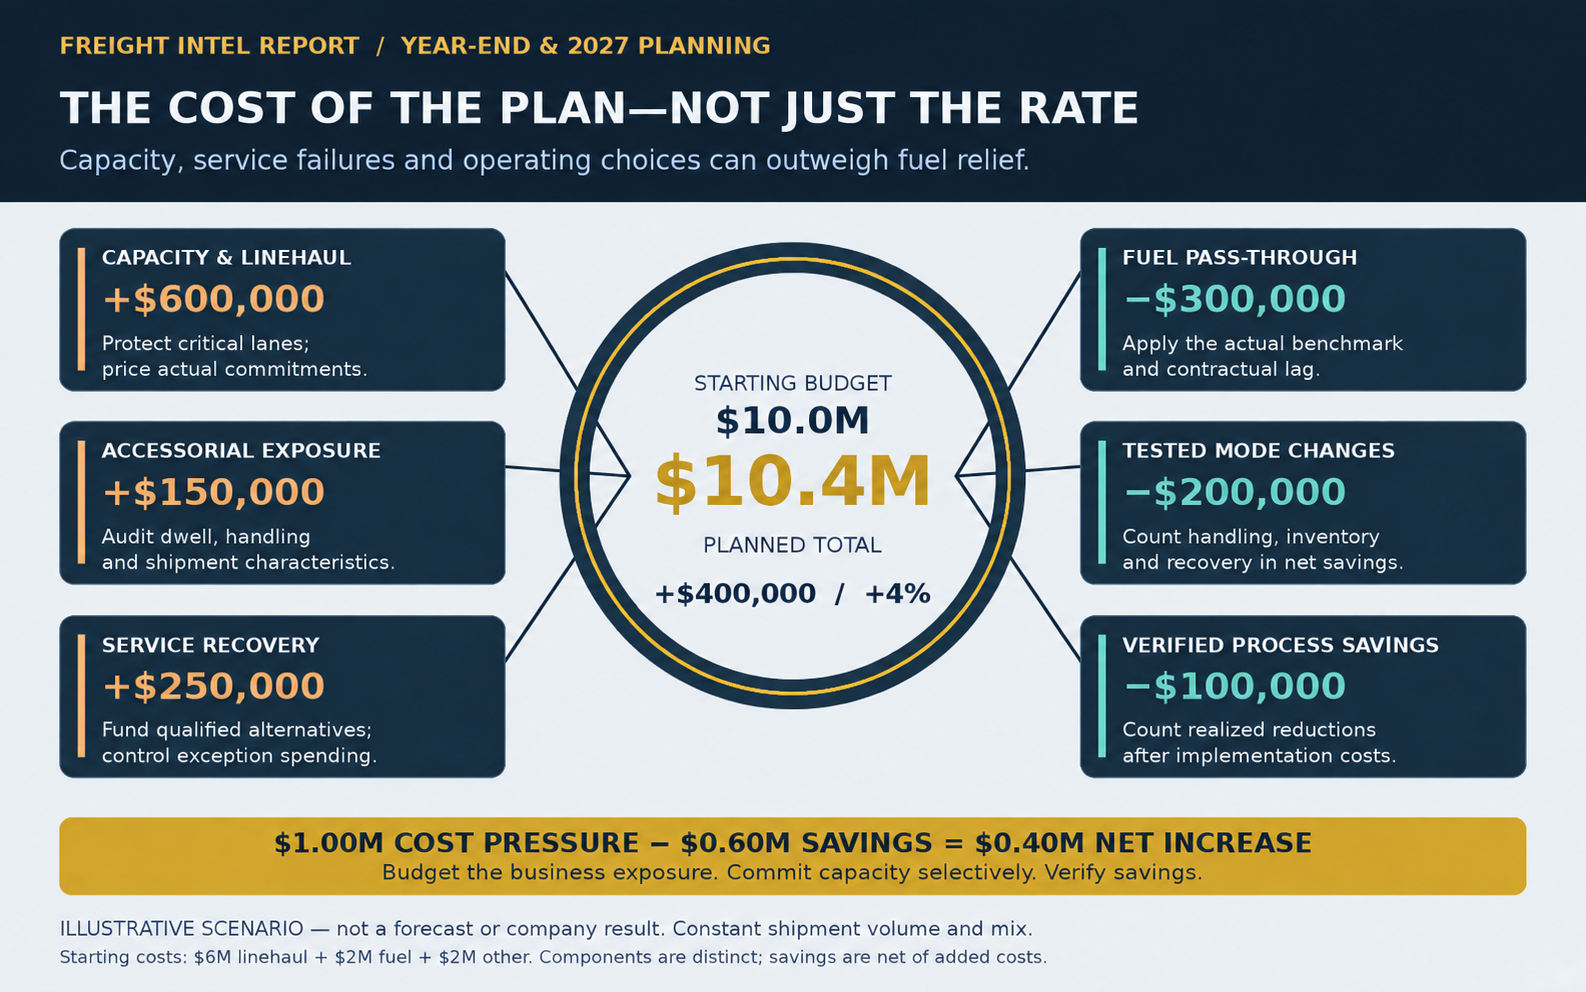
Shipment volume and mix + linehaul changes + fuel + accessorials + inventory and handling + service recovery − verified operating savings.
Keep tariffs and duties visible in the landed-cost budget rather than labeling them transportation charges. Similarly, separate technology subscriptions, warehouse labor and carrying costs from carrier rates, while retaining them in the full supply-chain view.
This prevents three common errors: applying a rate increase to an already fuel-inclusive amount, claiming modal savings without counting added handling, and calling a spending reduction a procurement win when it actually came from fewer orders.
An illustrative $10 million transportation budget shows the arithmetic. Assume $6 million of linehaul, $2 million of fuel and $2 million of other charges. A 10% linehaul increase adds $600,000. A 15% fuel decline saves $300,000. With everything else unchanged, spending still rises $300,000, or 3%.
Those percentages are hypothetical—not FIR forecasts. The lesson is that falling fuel can offset only part of a rising capacity bill. Apply the actual contract formula, including its base, steps, lag and regional benchmark, to determine the fuel line.
Create an explicit disruption reserve from the company’s exposure: affected shipments multiplied by incremental recovery cost, with a stated scenario. Do not select a generic contingency percentage simply because it makes the budget balance. Finance should know what releases the reserve, who approves spending and when an exception expires.
Secure the freight that cannot fail
Divide the shipment program into three groups.
Critical commitments: Production-stopping materials, temperature-sensitive cargo and firm customer deadlines require confirmed coverage, escalation ownership and a usable fallback.
Repeatable base volume: Stable, well-described lanes may support contract, dedicated or scheduled multimodal service. Commit only the volume the business can reasonably substantiate, and document the consequences if it does not materialize.
Variable demand: Forecast orders, promotions and irregular moves need flexibility. Avoid converting uncertainty into an excessive minimum-volume obligation merely to obtain a lower headline rate.
For each group, compare awarded capacity with capacity actually accepted. Track primary acceptance, backup use, spot exposure, missed pickups and on-time delivery by lane and equipment. A low contract rate that repeatedly sends freight to the spot market is not the cost of the program.
Correct shipper-created friction first: late tenders, changing pickup times, excessive dwell, poor shipment data and unpredictable receiving hours. Then negotiate the residual capacity exposure. A provider should be able to explain what service it can commit to and what assumptions support the commitment.
Put the business consequence ahead of the mode
The same delay has different consequences across industries. Classify the business exposure before asking a provider to price the shipment. These are planning examples, not claims about any individual company’s operations.
| Business context | Year-end decision | What the 2027 plan should measure |
|---|---|---|
| Food, beverage and grocery | Protect replenishment windows; separate ambient from temperature-controlled requirements; check usable shelf life after delivery | Availability, spoilage and rejected loads alongside transport cost; receiving dwell and actual equipment coverage |
| Healthcare and medical distribution | Identify genuinely critical deliveries and product-specific handling requirements; qualify a recovery route before an exception | Delivery at the point of need, documented handling and traceability; the cost of recovery without unnecessary expedited volume |
| Retail and e-commerce | Connect promotional demand, inventory placement and customer promises to peak calendars; prepare returns | Cost per fulfilled order, inventory availability, parcel charge exposure and the service performance of alternative fulfillment nodes |
| Furniture and bulky home goods | Compare consolidation and delivery frequency against handling damage, storage and final-mile appointments | Cost per successfully completed delivery, damage and re-delivery; total expense through the customer’s receiving point |
| Manufacturing, building materials and infrastructure | Separate production-critical or sequenced items from stable bulk flows; match site access and equipment to the cargo | Production or site readiness, equipment utilization, unloading delays and the full cost of rail, transload or project alternatives |
Procurement should define the tolerable failure first. Operations should confirm that the proposed service can meet it. Finance should value the exposure. That sequence makes the rate negotiation more precise.
For example, a bulky-product routing change that saves linehaul but increases damage or missed home-delivery appointments can destroy the saving. A medical or production-critical shipment may justify a premium; that does not make every shipment in the account an expedite. A food program needs delivery and handling assumptions tied to the actual product, rather than a generic promise of refrigerated capacity.
Evaluate modes against the same delivery requirement
A modal review should compare the same origin, destination, cargo, delivery window and charge scope. Require both an expected outcome and a disruption case.
| Mode or service | Where to test it | What can erase the apparent saving |
|---|---|---|
| Truckload or dedicated | Time-sensitive lanes, consistent flows and equipment-specific requirements | Empty miles, underutilization, dwell, failed tenders and minimum commitments |
| LTL, consolidation or pool distribution | Smaller recurring shipments that can share transport or delivery networks | Extra handling, damage, storage, minimum charges and lost delivery frequency |
| Intermodal rail | Repeatable lanes with workable terminal access and delivery buffers | Drayage, terminal availability, equipment, destination appointments and recovery trucking |
| Ocean routing or alternative gateways | Import programs with enough planning time to compare complete routes | Longer inland moves, transloading, missed connections and inventory exposure |
| Air or expedited service | Small quantities whose delay cost exceeds the premium | Unqualified capacity, chargeable-weight differences, handling restrictions and destination delays |
| Barge, bulk rail or transload | Dense, recurring commodity or project flows with usable infrastructure | Fixed facilities, batch inventory, handling and inadequate recovery options |
For a modal conversion, calculate the transportation saving after added carrying cost, handling, damage exposure and expected recovery expense. Test service with representative shipments before scaling. Critical materials should retain a fallback even when the base mode changes.
A particularly useful alternative is a partial expedite: move the quantity needed to protect production or a customer commitment quickly, while the balance stays on the economical service. The relevant question is how much cargo must arrive sooner—not whether the entire shipment must move faster.
Q4 has several clocks, and they do not stop on December 31
Peak calendars: Holiday demand charges, carrier cutoffs, warehouse closures and reduced operating days can affect both cost and service. Reverse-logistics volume can extend the workload into January. Price shipments using their planned tender dates and package characteristics.
Winter fuel and weather: EIA expects East Coast distillate inventories to remain 20%–30% below their five-year average through the coming winter. This is a forecast, not a prediction of an outage. Identify fuel-sensitive lanes, temperature-control requirements and alternative receiving arrangements; activate contingencies from documented service conditions.
Geopolitics and trade: Energy and maritime disruption, tariff changes and customs requirements can affect sourcing, routing and landed cost. Monitor enacted rules and carrier notices separately from proposals. Do not reprice the entire network because a policy is being discussed.
Operating capacity: Driver availability, equipment downtime and provider financial pressure can restrict particular services even without a national volume surge. Verify the providers covering critical lanes and maintain independently verified contacts, especially for changes to payment instructions or shipment control.
January contract resets: FedEx has announced an average 5.9% increase in standard package list rates effective January 4, 2027, alongside fee and ZIP-code changes. Further announced changes follow January 18 and February 1. A shipper’s realized increase depends on its shipment profile and contract. Run representative packages through the new rules before approving customer pricing or free-shipping promises.
Keep an event register with an owner, affected shipments, evidence source and decision trigger. “Monitor the situation” is not an operating plan until someone knows what happens when the trigger is reached.
Make risk and technology earn a place in the budget
Capacity is only useful if the provider can execute and the shipment remains under verified control. Review recovery responsibility, cargo coverage, exclusions, claim procedures and contractual liability with the appropriate specialists. An insurance certificate alone does not establish coverage for every commodity, location or circumstance.
Budget loss prevention and claims separately from carrier rates. Include shipment identity checks, independently verified instructions, documented handoffs and escalation contacts. A rushed replacement provider should face the same required verification as the incumbent; urgency should not become an exception to shipment-control procedures.
Visibility and automation also need a measurable business case. Before adding a TMS module, AI workflow or tracking subscription, specify the problem it will solve: late exception detection, manual invoice rework, poor forecast-to-capacity matching or preventable accessorials.
Set a baseline, assign an owner and run a controlled pilot. Measure avoided expense, staff time actually redeployed and service improvement. Count integration, data cleanup, training, support and review time in the cost. A dashboard alert is not a saving until it changes an operating outcome.
Keep human review at consequential exception points, including unverified provider changes, payments and commitments outside agreed authority. For 2027, the useful technology question is not how many processes can be automated. It is which decisions become earlier, more reliable and less expensive.
The 2027 outlook: relief is plausible; a cheap-capacity reset is not assured
EIA’s lower diesel forecast provides a reasonable planning reference, conditional on its supply and market assumptions. It does not justify budgeting every month at the annual average or assuming that carriers will surrender linehaul increases when fuel falls.
Truckload forecasts also require careful labeling. C.H. Robinson projects its dry-van spot cost-per-mile measure rising 10% in 2027. Arrive Logistics forecasts linehaul excluding fuel and expects rates to settle at a higher floor, with year-over-year growth moderating as comparisons become tougher. Their measures and assumptions differ; they cannot be combined into one universal rate increase.
Both companies sell transportation services. Their outlooks are useful market assessments, not independent guarantees or substitutes for competitive lane pricing.
FIR’s assessment is that the strongest 2027 plan will remain conditional. Build three cases:
| Planning case—not a prediction | Conditions to watch | Response |
|---|---|---|
| Relief | Fuel benchmarks decline, acceptance improves and service remains dependable | Retain fuel pass-through, rebid demonstrably uncompetitive lanes and release unnecessary contingency |
| Persistent pressure | Fuel moderates but capacity and non-fuel costs remain firm | Protect core coverage, improve utilization and implement tested modal changes |
| Disruption | Energy, weather, trade or provider failures impair affected lanes | Release targeted reserves, activate qualified alternatives and prioritize critical cargo |
Do not assign unsupported probabilities. Quantify the financial and service consequences of each case, then update assumptions as evidence changes. Lower year-over-year rate growth can simply mean the market is comparing against a higher base; it does not necessarily mean a lower invoice.
What each decision-maker should do
Shippers: Own the demand forecast and service requirements. Give providers usable shipment data, separate contractual fuel from linehaul, and measure delivered cost per appropriate physical unit alongside service. Purchase reliability where failure is expensive; preserve flexibility where the demand is uncertain.
Brokers and logistics providers: Translate the forecast into actual lane coverage. Make buy-rate exposure, quote validity, exceptions and recovery responsibilities explicit. Verify carrier identity and capacity; do not sell a firm commitment supported only by an untested spot-market assumption. Protect margin by reducing operating friction rather than hiding new charges.
Carriers: Bid the operating plan, including empty movement, dwell, equipment and payment timing. Match commitments to available drivers and assets. Document fuel treatment and exceptions, and avoid adding permanent capacity solely in response to a short seasonal spike. Explain precisely which shipper changes would improve utilization or reduce the rate.
Transportation leaders and finance: Use one cost bridge and one service scorecard. Require evidence before counting savings, approving an emergency premium or signing a minimum commitment. Assign an owner to the assumptions that could break the budget. Report forecast error, primary acceptance, recovery spend, on-time delivery, dwell and claims alongside the rate.
International logistics and procurement teams: Compare gateways through the final receiving point, keep duties distinct from freight and match origin-country changes to product requirements. Confirm that a backup forwarder or route provides independent capacity; a second vendor using the same underlying service may preserve the same exposure.
Risk and technology leaders: Translate the operating plan into documented responsibilities and tested controls. Validate claims and exception data before using them in a model. Make system integration and decision ownership part of implementation, rather than afterthoughts.
A practical year-end execution calendar
By October 31: Reconcile shipment and invoice data, identify critical lanes, confirm peak receiving calendars and test the highest-value alternative modes. Obtain current provider coverage and January price-change files.
By November 30: Complete targeted bids, quantify the three budget cases, agree on contingency authority and test the systems that will calculate new charges. Confirm holiday and recovery coverage before operating hours contract.
By December 15: Finalize Q1 commitments, destination appointments and exception contacts. Validate TMS and rating changes against sample invoices. Prepare January returns and winter-service plans.
In January: Compare actual acceptance, service and invoice changes with the assumptions. Correct the lanes that deviate before extending the plan across the year.
The next quarter should leave the business with more than a negotiated rate sheet. It should leave it with a defensible budget, an executable capacity plan and alternatives that work when needed.
That is the preparation that can survive an uncertain 2027.
Sources and reporting notes
Sources checked October 9, 2026. External website addresses are plain text; readers should navigate directly to the named publications.
- U.S. Energy Information Administration, October 6 Short-Term Energy Outlook, Petroleum Products: eia.gov/outlooks/steo/report/petro_prod.php.
- C.H. Robinson, October 2026 North America Truckload Freight Market Update: chrobinson.com; Resources → Freight Market Update → October 2026 → North America Truckload.
- Arrive Logistics, 2027 Truckload Freight Forecast: arrivelogistics.com/insights/2027-truckload-freight-forecast/.
- IATA, August 2026 air-cargo release, September 29: iata.org; Pressroom → 2026 releases.
- Descartes, October Global Shipping Report, released October 8: descartes.com; Knowledge Center.
- FedEx, Shipping Rate Changes, updated September 18: fedex.com/en-us/shipping/rate-changes.html.
The cost example, scenarios and execution deadlines are FIR planning analysis. They are not reported market prices, probability estimates or guarantees. Company forecasts are attributed; observation dates differ across sources.
Leave a Reply