
Manufacturers with tight component inventories should check confirmed supplier ship dates before postponing October freight bookings. September’s new-orders and backlog readings strengthened while input-price pressure increased: a small freight saving can disappear if waiting creates a production delay or an emergency shipment.
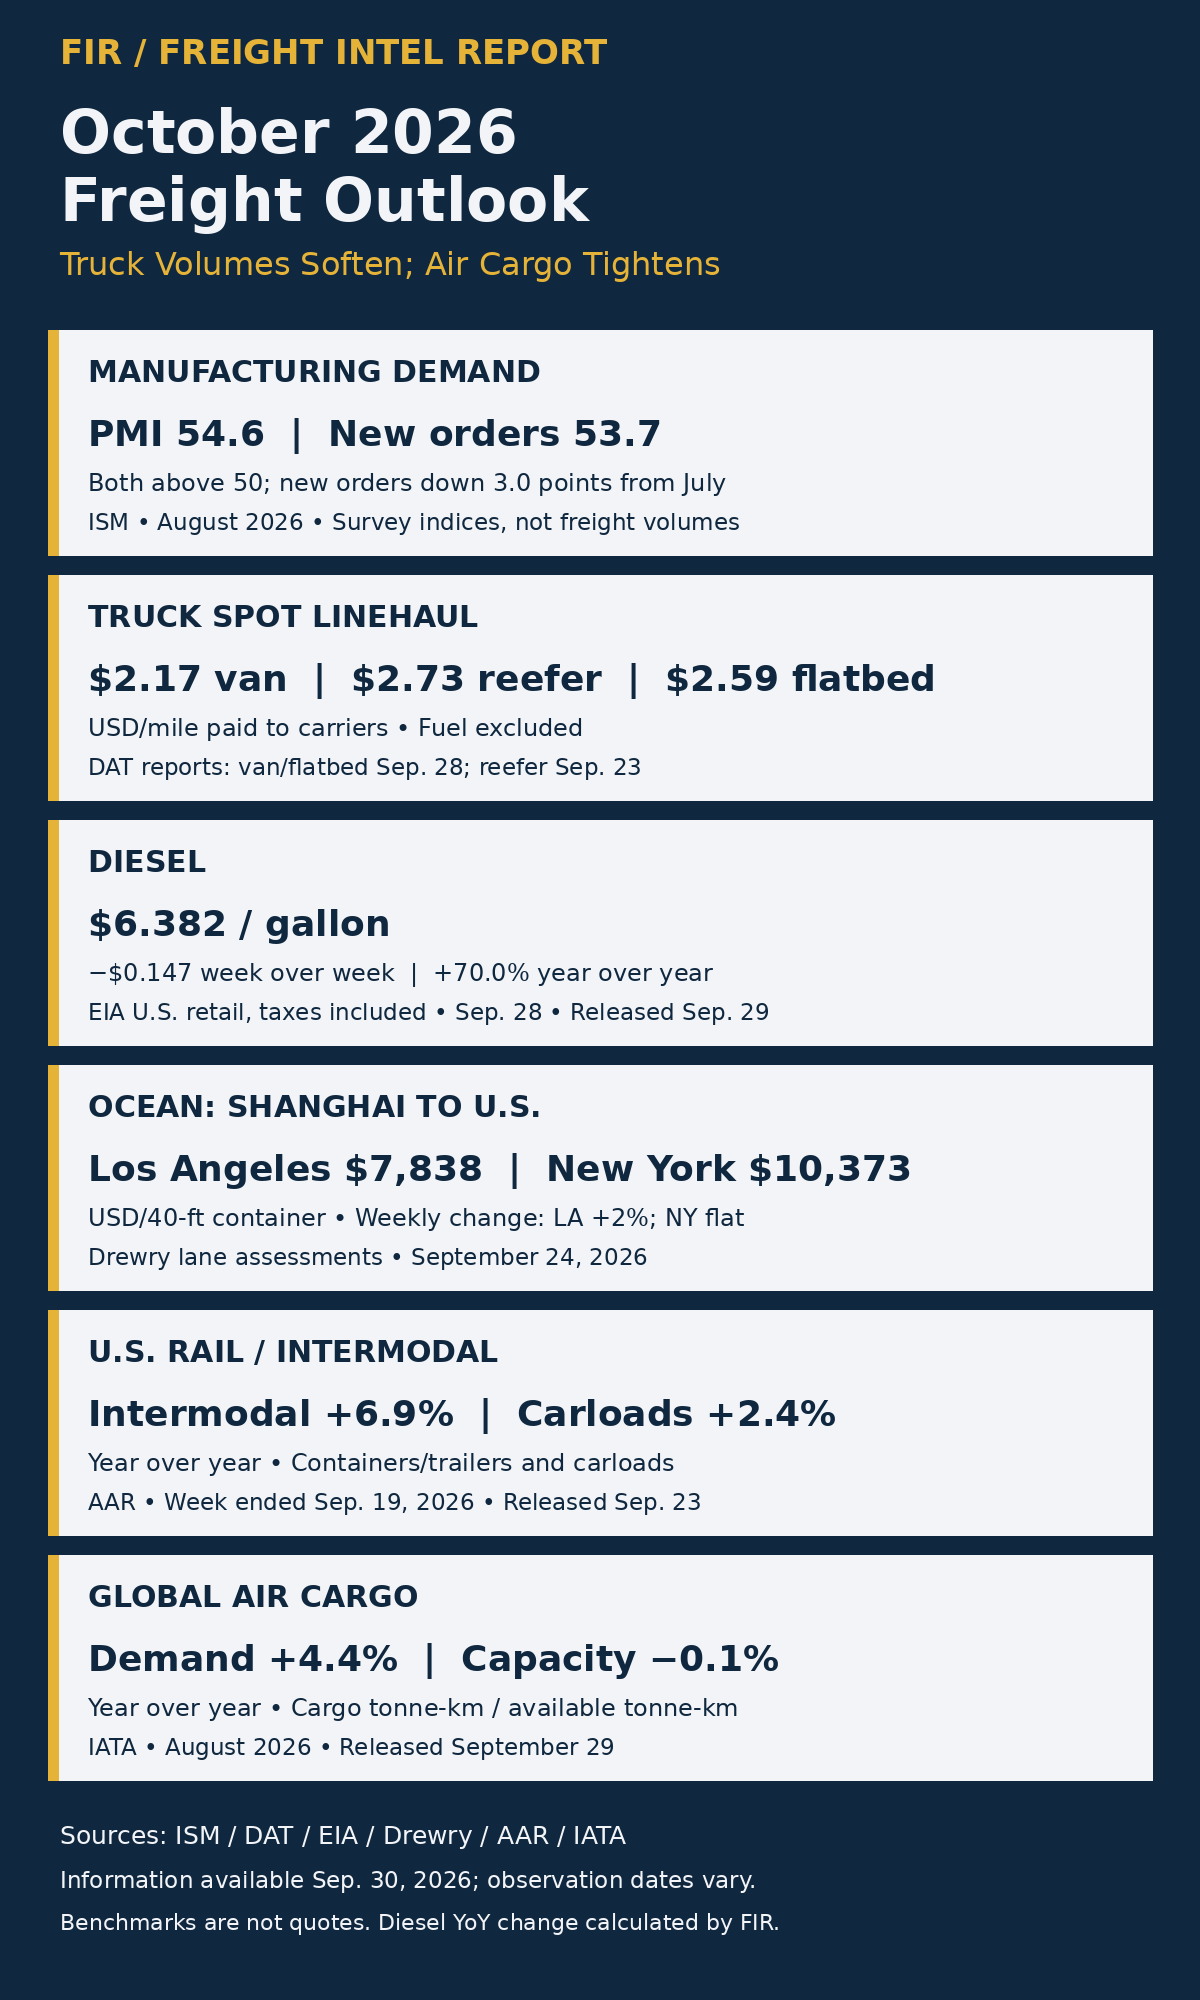
Updated October 5, 2026: manufacturing, refrigerated trucking, rail and ocean figures refreshed below. The six-panel dashboard above remains the original September 30 snapshot; the dated text below supersedes its affected figures.
A softer freight-volume report can tempt a procurement team to wait for a better rate. This October, that could be an expensive assumption.
U.S. truck tonnage fell in August, but late-September truck spot linehaul remained well above year-earlier levels. Rail volumes grew. Global air-cargo demand increased while available capacity edged down. Diesel eased in the latest week yet remained about 70% more expensive than a year earlier.
These are different markets, measured over different periods. Together, they suggest a practical October strategy: negotiate where shipment-level evidence supports it, secure scarce capacity where delay is costly, and keep fuel changes separate from the price of moving the load.
Truck demand is softer. The cost of securing a truck may not be.
ATA’s August for-hire tonnage index fell 0.5% from July and 1.6% from a year earlier. ATA attributes the firmer market to reduced capacity rather than strong demand. Its index is dominated by contract freight, so it should not be treated as a direct reading of spot-market availability.1
DAT’s September 28 report puts dry-van spot linehaul at $2.17 per mile, unchanged for the week. The October 1 reefer report puts linehaul at $2.71 per mile, down $0.02 from its prior report. The September 28 flatbed report remains $2.59. These are rates paid to carriers with fuel excluded—not a shipper’s all-in transportation invoice.2–4
The distinction matters in a bid review. A lower tonnage reading does not establish that an incumbent’s rate is excessive. Compare the same origin, destination, equipment, lead time and service requirements, then examine acceptance rates and failed tenders. A cheaper quote that repeatedly falls through can create a higher delivered cost.
Use targeted bids on lanes with dependable alternatives. For a critical lane with declining acceptance, evaluate a limited capacity commitment against the cost of repeated spot recovery. Keep the commitment tied to a credible shipment forecast.
Fuel relief needs to reach the invoice through the agreed formula
EIA’s September 29 release reports U.S. retail on-highway diesel at $6.382 per gallon for September 28, including taxes. That is 14.7 cents lower than the prior week but $2.628 above a year earlier. FIR calculates the annual increase at 70.0%.5
For illustration, a surcharge formula using six miles per gallon would translate a $0.147-per-gallon decline into $0.0245 per mile, or $24.50 on 1,000 billable miles. Actual results depend on the contract’s benchmark, lag, base price, mileage and rounding. A stepped surcharge table may produce a different adjustment.
Audit that calculation separately from linehaul. Do not add the EIA pump price directly to DAT’s per-mile figure, or assume that a weekly fuel decline entitles a shipper to the same percentage reduction in its total freight bill.
Manufacturing and rail prevent a blanket “surface freight is weak” verdict
ISM’s September manufacturing PMI was 54.5, versus 54.6 in August. New orders rose 1.6 index points to 55.3; order backlogs rose 4.6 points to 56.4; and the prices index rose 6.8 points to 77.9. Supplier deliveries remained in slowing territory at 59.0, although the pace of slowing eased slightly. These are survey indexes, not percentage changes in freight volumes or input costs.6
FIR analysis: The September report changes the earlier picture of weakening order momentum. For a manufacturer exposed to late inbound components, compare each confirmed supplier ship date with the date inventory runs out and the customer’s delivery deadline. Price a fallback shipment while there is still time to choose it. This evidence supports selective protection of critical shipments, not blanket stockbuilding or a forecast of a freight boom.
AAR’s week ending September 26 adds another distinction: U.S. intermodal volume rose 6.3% year over year to 301,610 units and carloads increased 3.0% to 235,787. Year-to-date growth was 4.1% and 2.7%, respectively. Those counts support a more measured reading than treating one week as the trend for all of October.7
The broader BTS Freight Transportation Services Index fell 2.0% year over year in July. It includes multiple modes, including air and pipeline, and predates the latest rail week. Its decline cannot erase subsequent growth in individual modes.8
For a truck-to-intermodal move, test the actual corridor: door-to-door transit, drayage availability, terminal cutoffs, equipment and recovery options. National growth does not establish that a specific ramp has usable capacity—or that a shipment can tolerate an extra day.
Air is the clearest reason to prepare exceptions before they become emergencies
IATA reports August global cargo demand up 4.4% year over year, measured in cargo tonne-kilometers, while capacity fell 0.1%. North American carriers recorded demand growth of 6.6% and a capacity decline of 2.5%. That regional measure describes carriers, not every shipment touching North America.9
The figures indicate greater pressure on available air capacity; they do not establish a rate or space guarantee for a particular airport pair. For time-critical goods, obtain lane-specific quotes and confirm booking conditions before a surface delay forces an urgent conversion.
A useful exception file identifies the affected SKU, required arrival date, inventory coverage, incremental air cost and consequence of arriving late. The buyer can then compare a priced alternative with a documented business exposure, instead of approving an expedite simply because a shipment is behind plan.
Ocean buyers need a sailing decision as well as a rate decision
Drewry’s October 1 Shanghai–Los Angeles assessment was $7,835 per 40-foot container, essentially unchanged; Shanghai–New York was $10,428, up 1% on Drewry’s rounded weekly comparison. Its global composite fell 1% to $4,434. FIR calculates that the New York lane increased $55 from the September 24 assessment, while Los Angeles decreased $3. A falling global index has not delivered comparable relief on these two U.S. lanes.10
Forecast and uncertainty: Drewry expects rates to ease in the following week as China’s Golden Week reduces cargo volumes. That forecast is not a confirmed discount or a sailing guarantee. An importer considering waiting should compare the available saving with the next usable departure and the cost of missing its delivery window.
For October cargo, connect each quote to its validity date, named service and usable departure. Record what happens if the booking rolls and whether the fallback still meets the delivery requirement. A lower rate is of little value if the alternative sailing arrives after the goods are needed.
FIR’s container-index analysis examines the lane-versus-composite problem in detail. The Outlook’s additional question is how an ocean delay would affect the inland move or trigger an air exception.
The October buying plan: four decisions, four triggers
| Exposure | Evidence to watch | Decision to prepare |
|---|---|---|
| Truck | Lane acceptance, recovery spend and comparable fuel-excluded quotes | Rebid lanes with reliable alternatives; price a defined commitment where failed tenders cost more. |
| Air | Confirmed space and remaining inventory against the required arrival date | Approve an exception when the priced premium is justified by the documented delay exposure. |
| Ocean | Booking status, quote expiry and next usable sailing | Rebook when the original plan no longer meets the shipment’s delivery window. |
| Rail / intermodal | Corridor transit variability, equipment and drayage coverage | Shift suitable freight only when the full door-to-door plan fits the inventory buffer. |
Set those triggers from the shipper’s own service requirements and cost history. The published market indicators help frame the discussion; they cannot supply a universal acceptance threshold, inventory buffer or premium-spend limit.
October’s opportunity is to avoid paying for certainty where flexibility is affordable—and to secure capacity early where a failure would be expensive. That requires knowing which freight can wait, which cannot, and exactly what the quote includes.
Sources and methodology
Updated October 5, 2026; original edition published September 30. The dashboard preserves the September 30 baseline; revised figures and observation dates appear in the text. Monthly and weekly series have different coverage and observation periods; no composite forecast is calculated. Diesel annual change: $2.628 ÷ ($6.382 − $2.628) × 100 = 70.0%, rounded. The fuel example is illustrative. Benchmark figures are not executable quotes.
- ATA, August truck tonnage — https://trucking.org/news-insights/ata-truck-tonnage-index-fell-05-august, released September 22.
- DAT dry-van report — https://www.dat.com/blog/dry-van-report-falling-tonnage-tighter-market-as-the-supply-story-holds, September 28.
- DAT reefer report — https://www.dat.com/blog/reefer-report-rates-ease-as-produce-rush-cools-but-the-year-over-year-premium-holds, October 1.
- DAT flatbed report — https://www.dat.com/blog/flatbed-report-farm-iron-stacks-up-and-flatbed-demand-will-feel-it, September 28.
- EIA, Gasoline and Diesel Fuel Update, September 29 release; September 28 observation. Statistical source: https://www.eia.gov/petroleum/gasdiesel/.
- ISM September 2026 Manufacturing PMI report — https://www.ismworld.org/supply-management-news-and-reports/reports/ism-pmi-reports/pmi/september/, released October 1.
- AAR, week ending September 26 — https://www.aar.org/news/aar-reports-weekly-rail-traffic-for-the-week-ending-september-26-2026/, released September 30.
- BTS, July 2026 Freight Transportation Services Index, released September 9. Navigate directly to BTS’s official government website to consult the release.
- IATA, August air-cargo demand — https://www.iata.org/en/pressroom/2026-releases/09-29-air-cargo-demand-grows-august/, released September 29.
- Drewry World Container Index — https://www.drewry.co.uk/maritime-research-opinion-browser/world-container-index-assessed-by-drewry, October 1 assessment. This rolling source may subsequently update.
Related intelligence: FIR Multimodal Rate Monitor.

Leave a Reply