
A shipper building a fourth-quarter capacity plan can make an expensive mistake by treating a rising industry sales total as evidence that more freight is moving. The latest U.S. data support selective demand growth, with a sharper distinction between industries that are producing more and those reporting more dollars.
The practical consequence: reserve capacity around verified orders, production schedules and shipment counts. A broad recovery headline is too blunt a basis for adding trucks, raising volume commitments or assuming every commodity will face the same service pressure.
The updated industry totals
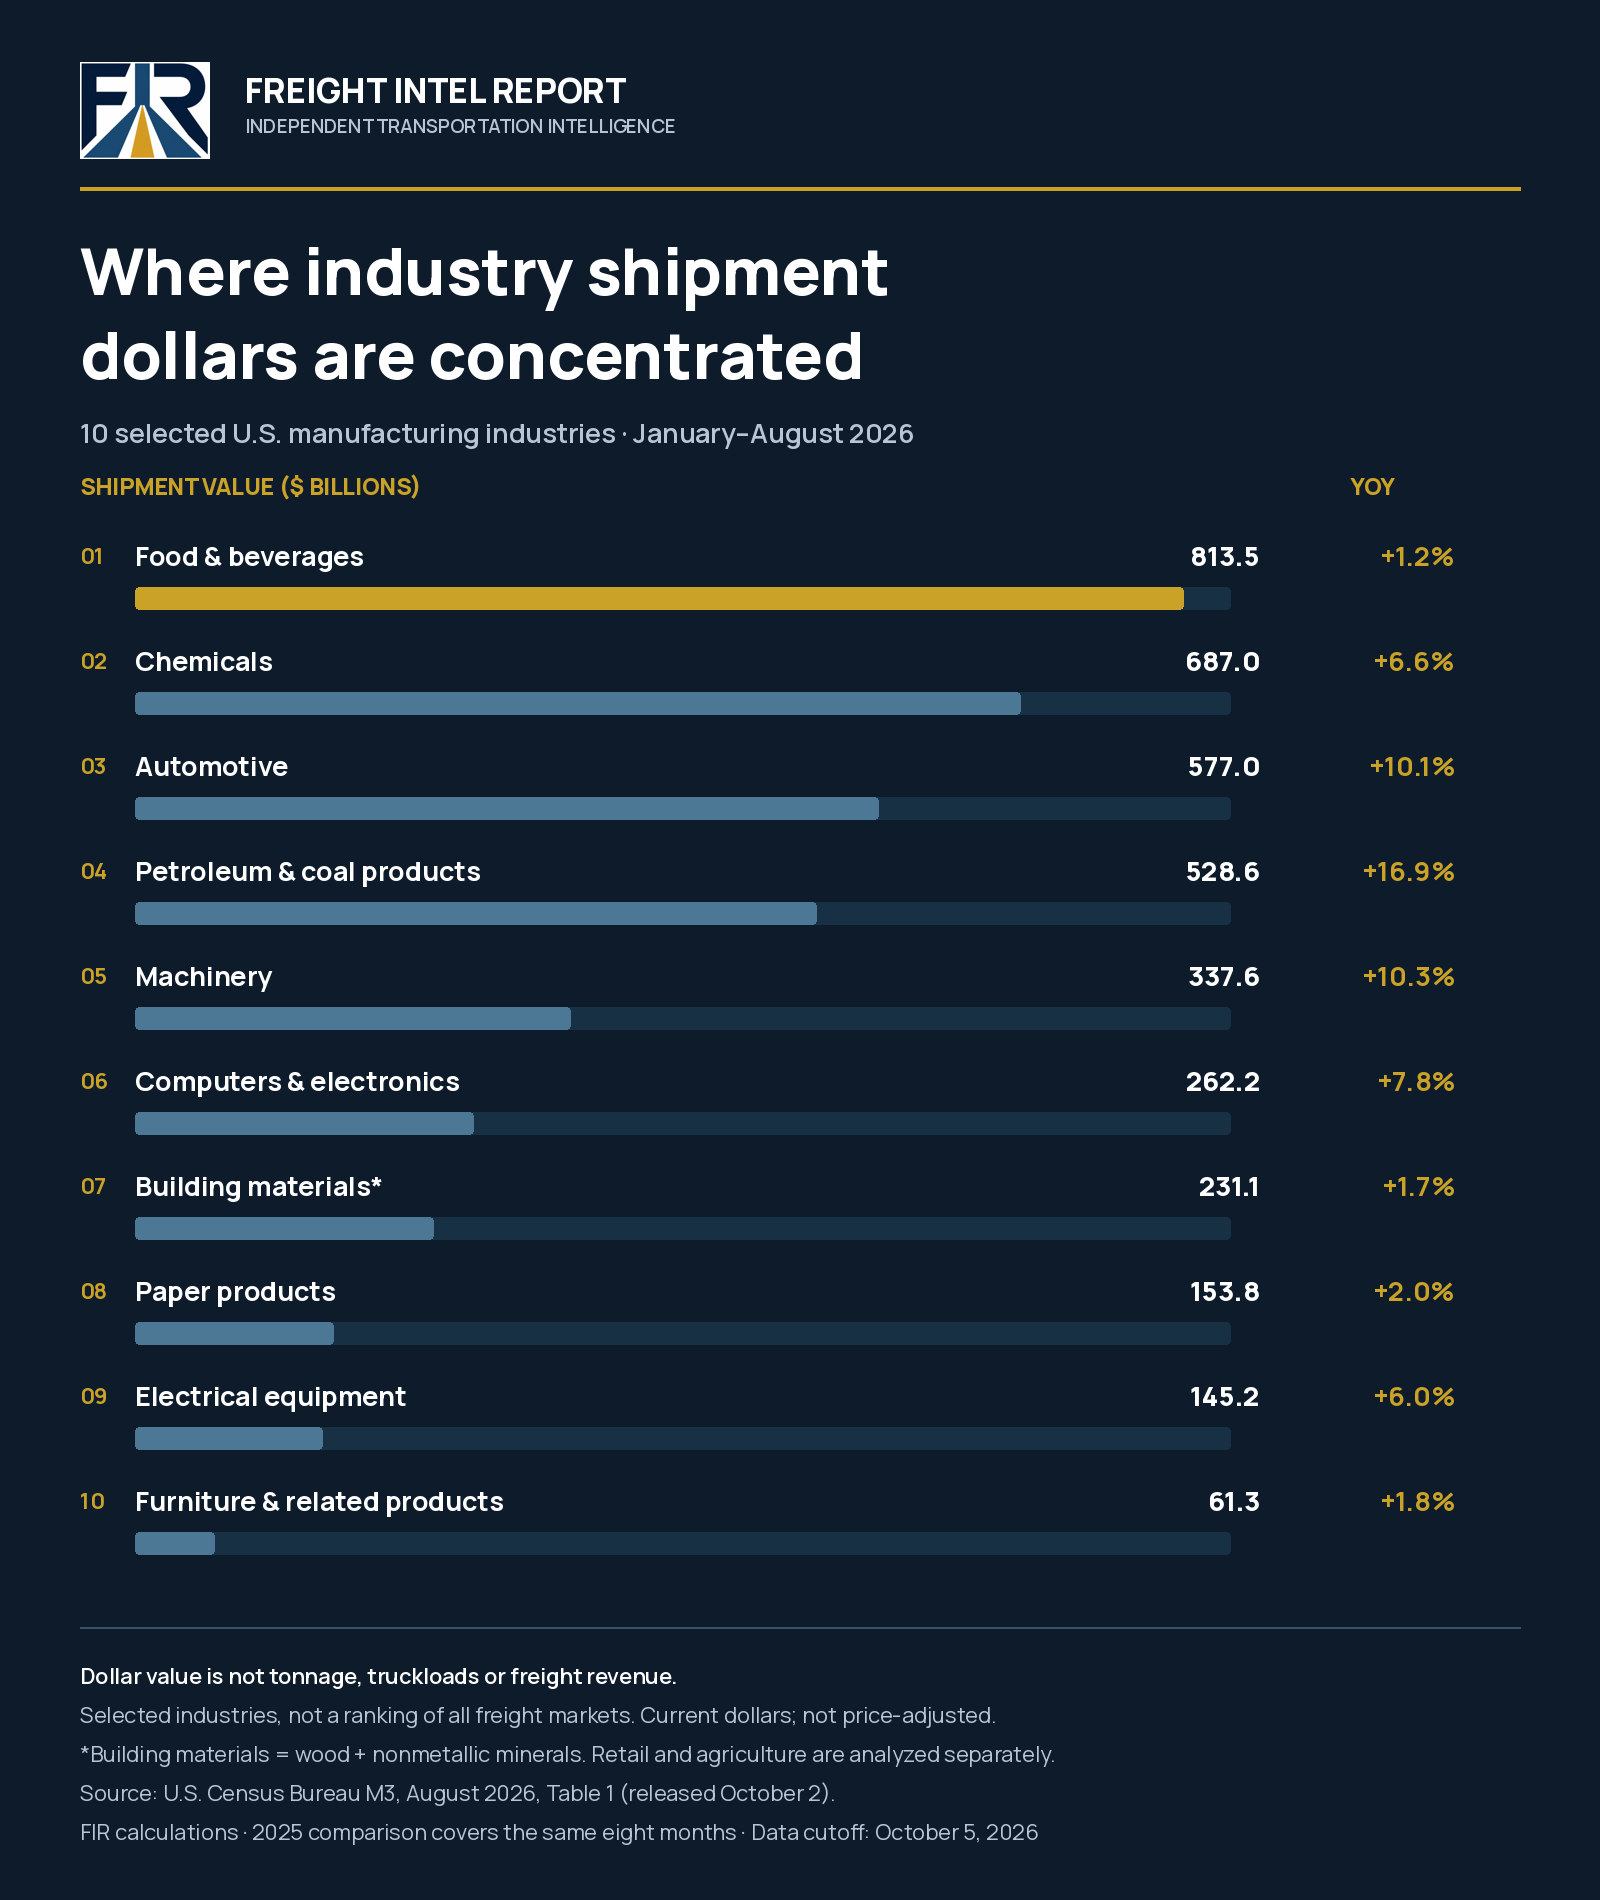
Food and beverages lead the ten selected manufacturing groups in FIR’s chart at $813.5 billion in January–August shipments. Chemicals and automotive follow. Petroleum and coal products show the strongest dollar growth among these groups.
These are manufacturers’ shipment values, not freight charges, tonnage or load counts. This is a selection of industries relevant to freight planning, not a national top-ten freight ranking. Retail and agriculture require separate measures. Industrial manufacturing is split into machinery, electronics and electrical equipment so its components remain visible.
The recovery looks different when output is measured
Federal Reserve figures provide the essential cross-check. August manufacturing output fell 0.3% from July and rose 0.9% from a year earlier. Within manufacturing, computers and electronics rose 8.7% year over year, machinery 6.3% and electrical equipment 5.5%. Paper fell 2.9%, furniture 2.8% and chemicals 2.6%.
That divergence matters. An industry can ship more dollars because of product mix or prices without generating a corresponding increase in freight movements. Conversely, higher production in a high-value industry need not translate into a proportional increase in truckloads. Equipment, density, packaging, inventory location and transport mode determine the actual capacity requirement.
The dollar chart covers eight months; the production comparison covers August against August. They are different measures and periods. Subtracting one growth rate from the other would not establish an inflation effect or a freight-volume forecast.
Ten commodity themes—and what to do with them
- Food and beverage: protect time-sensitive and temperature-controlled service around confirmed replenishment. The combined food, beverage and tobacco production category was down 1.2% year over year in August; its coverage differs from the chart, which excludes tobacco. Essential consumption supports recurring activity, but does not establish accelerating volume.
- Retail and consumer goods: August retail and food-services sales reached $773.9 billion, up 6.0% year over year. This is a separate, seasonally adjusted monthly sales measure and includes restaurants. Check units sold, inventory positioning and distribution-center orders before converting those dollars into peak-season truck commitments.
- Building materials: nonmetallic mineral output rose 2.8%, while wood fell 0.7%. Treat local project calendars and delivery windows as the planning unit. A combined national label can conceal a weaker wood market beside stronger activity in another material.
- Industrial manufacturing: machinery, electronics and electrical equipment have the clearest positive production signals in this selection. Follow actual plant schedules and supplier releases. Large dollar totals in electronics can support specialized or expedited movements without creating equivalent growth in general dry-van demand.
- Agriculture: USDA’s September forecast put 2026/27 U.S. corn production at 15.8 billion bushels, below the prior season’s estimated 17.021 billion. Harvest can still create concentrated local equipment pressure. Separate the annual crop projection from the timing of elevator, storage, rail and export movements.
- Paper and packaging: paper shipment dollars increased while measured August production declined. Validate packaging orders and shipment counts directly; do not use stronger nominal totals as proof of additional outbound loads. The chart covers paper, not the entire packaging market.
- Chemicals: a large dollar base coexists with softer measured production. Segment liquid bulk, dry products and packaged chemicals. Confirm product-specific demand, qualified equipment and loading requirements before broadening capacity commitments.
- Automotive: August motor-vehicle and parts output was down 1.0% year over year despite higher year-to-date shipment value in the chart. Production changes can alter component lanes quickly. Tie capacity decisions to customer releases and assembly schedules rather than industry revenue alone.
- Energy products: petroleum and coal product output rose 0.8% year over year in August. The chart’s much stronger nominal growth is not evidence of matching physical freight growth. Track refinery movements, terminal availability and fuel economics separately; this group excludes the broader energy economy.
- Furniture and home goods: furniture production weakness argues for measured replenishment commitments. Monitor orders, delivery appointments, damage exposure and inventory aging. The manufacturing category is narrower than all home goods, and a dollar increase alone does not justify assuming a stronger delivery pipeline.
What the fourth quarter and early 2027 could bring
September’s ISM manufacturing survey points toward expansion: its PMI was 54.5 and new-orders index 55.3. The prices index reached 77.9. These are diffusion indexes, not percentage growth rates. They suggest wider reported activity alongside persistent input-cost pressure, without guaranteeing that orders will become physical freight.
FIR’s working outlook is selective growth. Favor industries where production and customer orders reinforce each other. Keep flexible capacity for retail replenishment and harvest-related surges, while requiring firmer evidence before adding durable commitments in weaker production categories. This is an analytical judgment, not a numerical forecast.
The upside case: new orders turn into sustained production and replenishment across more industries. If that happens, review backup capacity before service failures force emergency buying. Look for repeated increases in plant output and tendered shipments, not a single stronger survey reading.
The downside case: rising costs restrain orders, or stronger nominal sales fail to produce more units. In that case, preserve flexible volume bands and review inventory before buying capacity for demand that has not materialized.
For early 2027, the decisive question is whether growth broadens beyond the industries already showing stronger output. Three checks can answer it: customer orders converting to scheduled production; actual shipment counts rising on the relevant lanes; and inventories clearing without repeated discounting or rescheduling. Revisit commitments when those signals change.
The capacity decision
Build the plan from the shipment outward: commodity, facility, lane, equipment, service window and confirmed quantity. Use industry intelligence to decide where to investigate first. Then let the customer’s physical freight determine the commitment. A national dollar ranking is useful context; it cannot tell a dispatcher how many trailers a plant needs next week.
Methodology and sources
Research cutoff: October 5, 2026. Chart: U.S. Census Bureau M3 Table 1, August 2026, released October 2; unadjusted year-to-date current-dollar totals. FIR combined food with beverages; automotive combines automobiles, light trucks, heavy trucks, and bodies, parts and trailers. Building materials combines wood with nonmetallic minerals. Growth compares January–August 2025 and 2026. Values are rounded to one decimal billion; building materials includes only wood and nonmetallic mineral products. No composite outlook score is used. Source revisions may change later totals.
Primary references are shown as plain-text addresses:
- U.S. Census Bureau, M3 Table 1: www.census.gov/manufacturing/m3/prel/pdf/table1p.pdf
- Federal Reserve, Industrial Production, August 2026 and Table 1: www.federalreserve.gov/releases/g17/current/ and www.federalreserve.gov/releases/g17/current/table1.htm
- U.S. Census Bureau, August retail sales: www.census.gov/retail/sales.html
- USDA, September 11 WASDE: www.usda.gov/oce/commodity/wasde/wasde0926.txt
- ISM, September Manufacturing PMI: www.ismworld.org/supply-management-news-and-reports/reports/ism-pmi-reports/pmi/september/

Leave a Reply