
Railroads are moving more freight and collecting substantially more revenue. For shippers negotiating 2027 transportation budgets, those are two different developments—and neither, by itself, establishes what the next contract should cost.
Norfolk Southern reported Thursday that third-quarter revenue rose 14% while volume increased 3%. Higher fuel surcharges accounted for eight percentage points of revenue growth. Union Pacific reported a 15% increase in operating revenue and 6% volume growth; its freight revenue excluding fuel surcharges increased 6%.
The procurement question is what remains after fuel, shipment mix and volume are separated—and what service a customer receives for the price. A railroad-wide financial result is evidence about the business. It is not a rate quotation for an individual lane.
The number to challenge is the proposed increase, not the earnings headline
A supplier can accurately report rising revenue without every customer paying the same increase. Revenue changes when shipment counts, commodity mix, distance, fuel recovery, ancillary charges and negotiated prices change. Different combinations can produce the same headline.
Norfolk Southern’s fuel contribution explains much of its reported revenue growth. It does not make the remaining six percentage points a pure pricing measure: volume and mix also matter. Subtracting volume growth from revenue growth is likewise not a defensible estimate of a shipper’s rate increase.
Union Pacific’s figures require similar care. Equal 6% growth in volume and freight revenue excluding fuel does not establish that core prices were unchanged. Commodity and lane mix can offset negotiated increases. The company separately identified core pricing gains and an unfavorable mix effect.
For a renewal, request a bridge from the current invoice to the proposed invoice using the same shipment file. Hold origins, destinations, equipment, shipment counts and service assumptions constant. Show base transportation, fuel and each material accessorial separately. Then run the forecast shipment mix as a second calculation.
That produces two useful answers: the price of moving the same freight under the new terms, and the budget impact of moving a different freight portfolio. Combining them hides the source of the increase.
A service improvement has value only if the shipper can capture it
Rail procurement frequently treats price as measurable and service as a narrative. A renewal should put both into the same business case.
For each important lane, compare the promised transit with actual door-to-door performance. Separate average transit from late-arrival frequency, missed delivery appointments and the time equipment spends unavailable. Network averages cannot establish how consistently a particular terminal pair meets a customer’s production window.
Consider a clearly hypothetical program moving $120 million of inventory annually. One fewer day in transit reduces average inventory in motion by approximately $329,000, calculated as $120 million divided by 365. At an assumed 20% annual carrying rate, the carrying-cost benefit is about $66,000 a year.
That is an economic illustration, not a cash refund or a forecast. The benefit requires an actual reduction in transit or replenishment inventory; safety stock, ownership terms and ordering practices can change the result. A $100,000 annual rate increase would therefore not be justified by that carrying-cost benefit alone. Conversely, avoided production interruptions or premium shipments might materially strengthen the case—but need their own evidence.
Ask the provider to identify the service improvement, the affected lanes, the measurement period and the remedy if performance falls short. Do not pay for a network promise that cannot be connected to your shipments.
Capacity should be purchased at the bottleneck
Norfolk Southern’s management attributed growing rail demand partly to a tighter trucking market. That is a company assessment, not proof that truck capacity is scarce on every lane or that rail has unlimited room to absorb diverted freight.
A modal alternative can fail at origin pickup, an intermodal terminal, an equipment pool or destination drayage even when the linehaul train has space. Before committing incremental volume, confirm who controls each handoff and which capacity is actually committed.
Intermodal buyers should test equipment availability, gate cutoffs, terminal storage rules, drayage appointments and recovery after a missed connection. Carload buyers should test suitable railcar supply, loading and unloading capacity, switching frequency and the effect of a missed local service. These are different operating problems and require different commitments.
Allocate dependable base volume where the service and full delivered cost work. Preserve a priced recovery option for shipment exceptions. An alternative that exists only in a presentation will not protect a customer deadline.
Turn the renewal into three decisions
First, establish the comparable price. Reprice a representative shipment file under current and proposed terms. Document the fuel index and lag, accessorial changes, minimum charges and the treatment of low-volume weeks. Avoid combining a base-rate increase with a fuel assumption that charges twice for the same exposure.
Second, establish the service bargain. Specify pickup and delivery responsibilities, performance measurement, exception notification and escalation ownership. Evaluate whether improved reliability actually permits lower inventory, fewer expedites or better customer service. Savings should have an operational owner as well as a spreadsheet formula.
Third, establish the commitment boundary. Match minimum-volume or equipment commitments to demand the business can reasonably support. Model a softer-demand case and a peak-demand case. Price the consequences of falling short, exceeding the allocation or changing the shipment mix before signing.
What this means for brokers, carriers and logistics leaders
Brokers and intermodal providers can distinguish their proposals by making the handoffs visible. State which rail, equipment and drayage obligations are secured, which depend on third parties, and which costs can change. A transparent recovery plan is more useful than a general claim that rail is cheaper.
Truck carriers competing with rail should identify where flexibility has measurable value: short replenishment windows, variable release times, specialized handling or costly missed appointments. Show the customer that value alongside the complete price rather than relying on a linehaul comparison.
Shippers should bring procurement, operations and finance into the same award decision. Procurement can negotiate the rate; operations must deliver the service assumptions; finance should validate whether the claimed benefit reduces expense, releases working capital or merely changes an accounting allocation.
The 2027 negotiating position
Today’s results strengthen the case for a more precise rail bid, not an automatic acceptance or rejection of higher rates. Revenue growth does not prove an equivalent customer price increase, and improved railroad performance does not guarantee a benefit on every corridor.
The strongest renewal file will show a comparable shipment price, a measurable service obligation and a workable capacity fallback. That is how a shipper turns public earnings information into negotiating evidence without mistaking a corporate average for its own transportation economics.
Sources and methodology
Union Pacific, Third Quarter 2026 Results, October 22, 2026. Reference address: www.up.com/press-releases/financial/3q26-earnings-261022
Norfolk Southern, Third Quarter 2026 Results, October 22, 2026. Reference address: norfolksouthern.investorroom.com/image/NSC_Q3_2026_Press_Release_FINAL.pdf
The inventory example is an illustrative FIR calculation using explicitly assumed values. It is not a reported customer result. Company financial measures are presented as reported; their growth rates are not estimates of individual contract-rate changes.
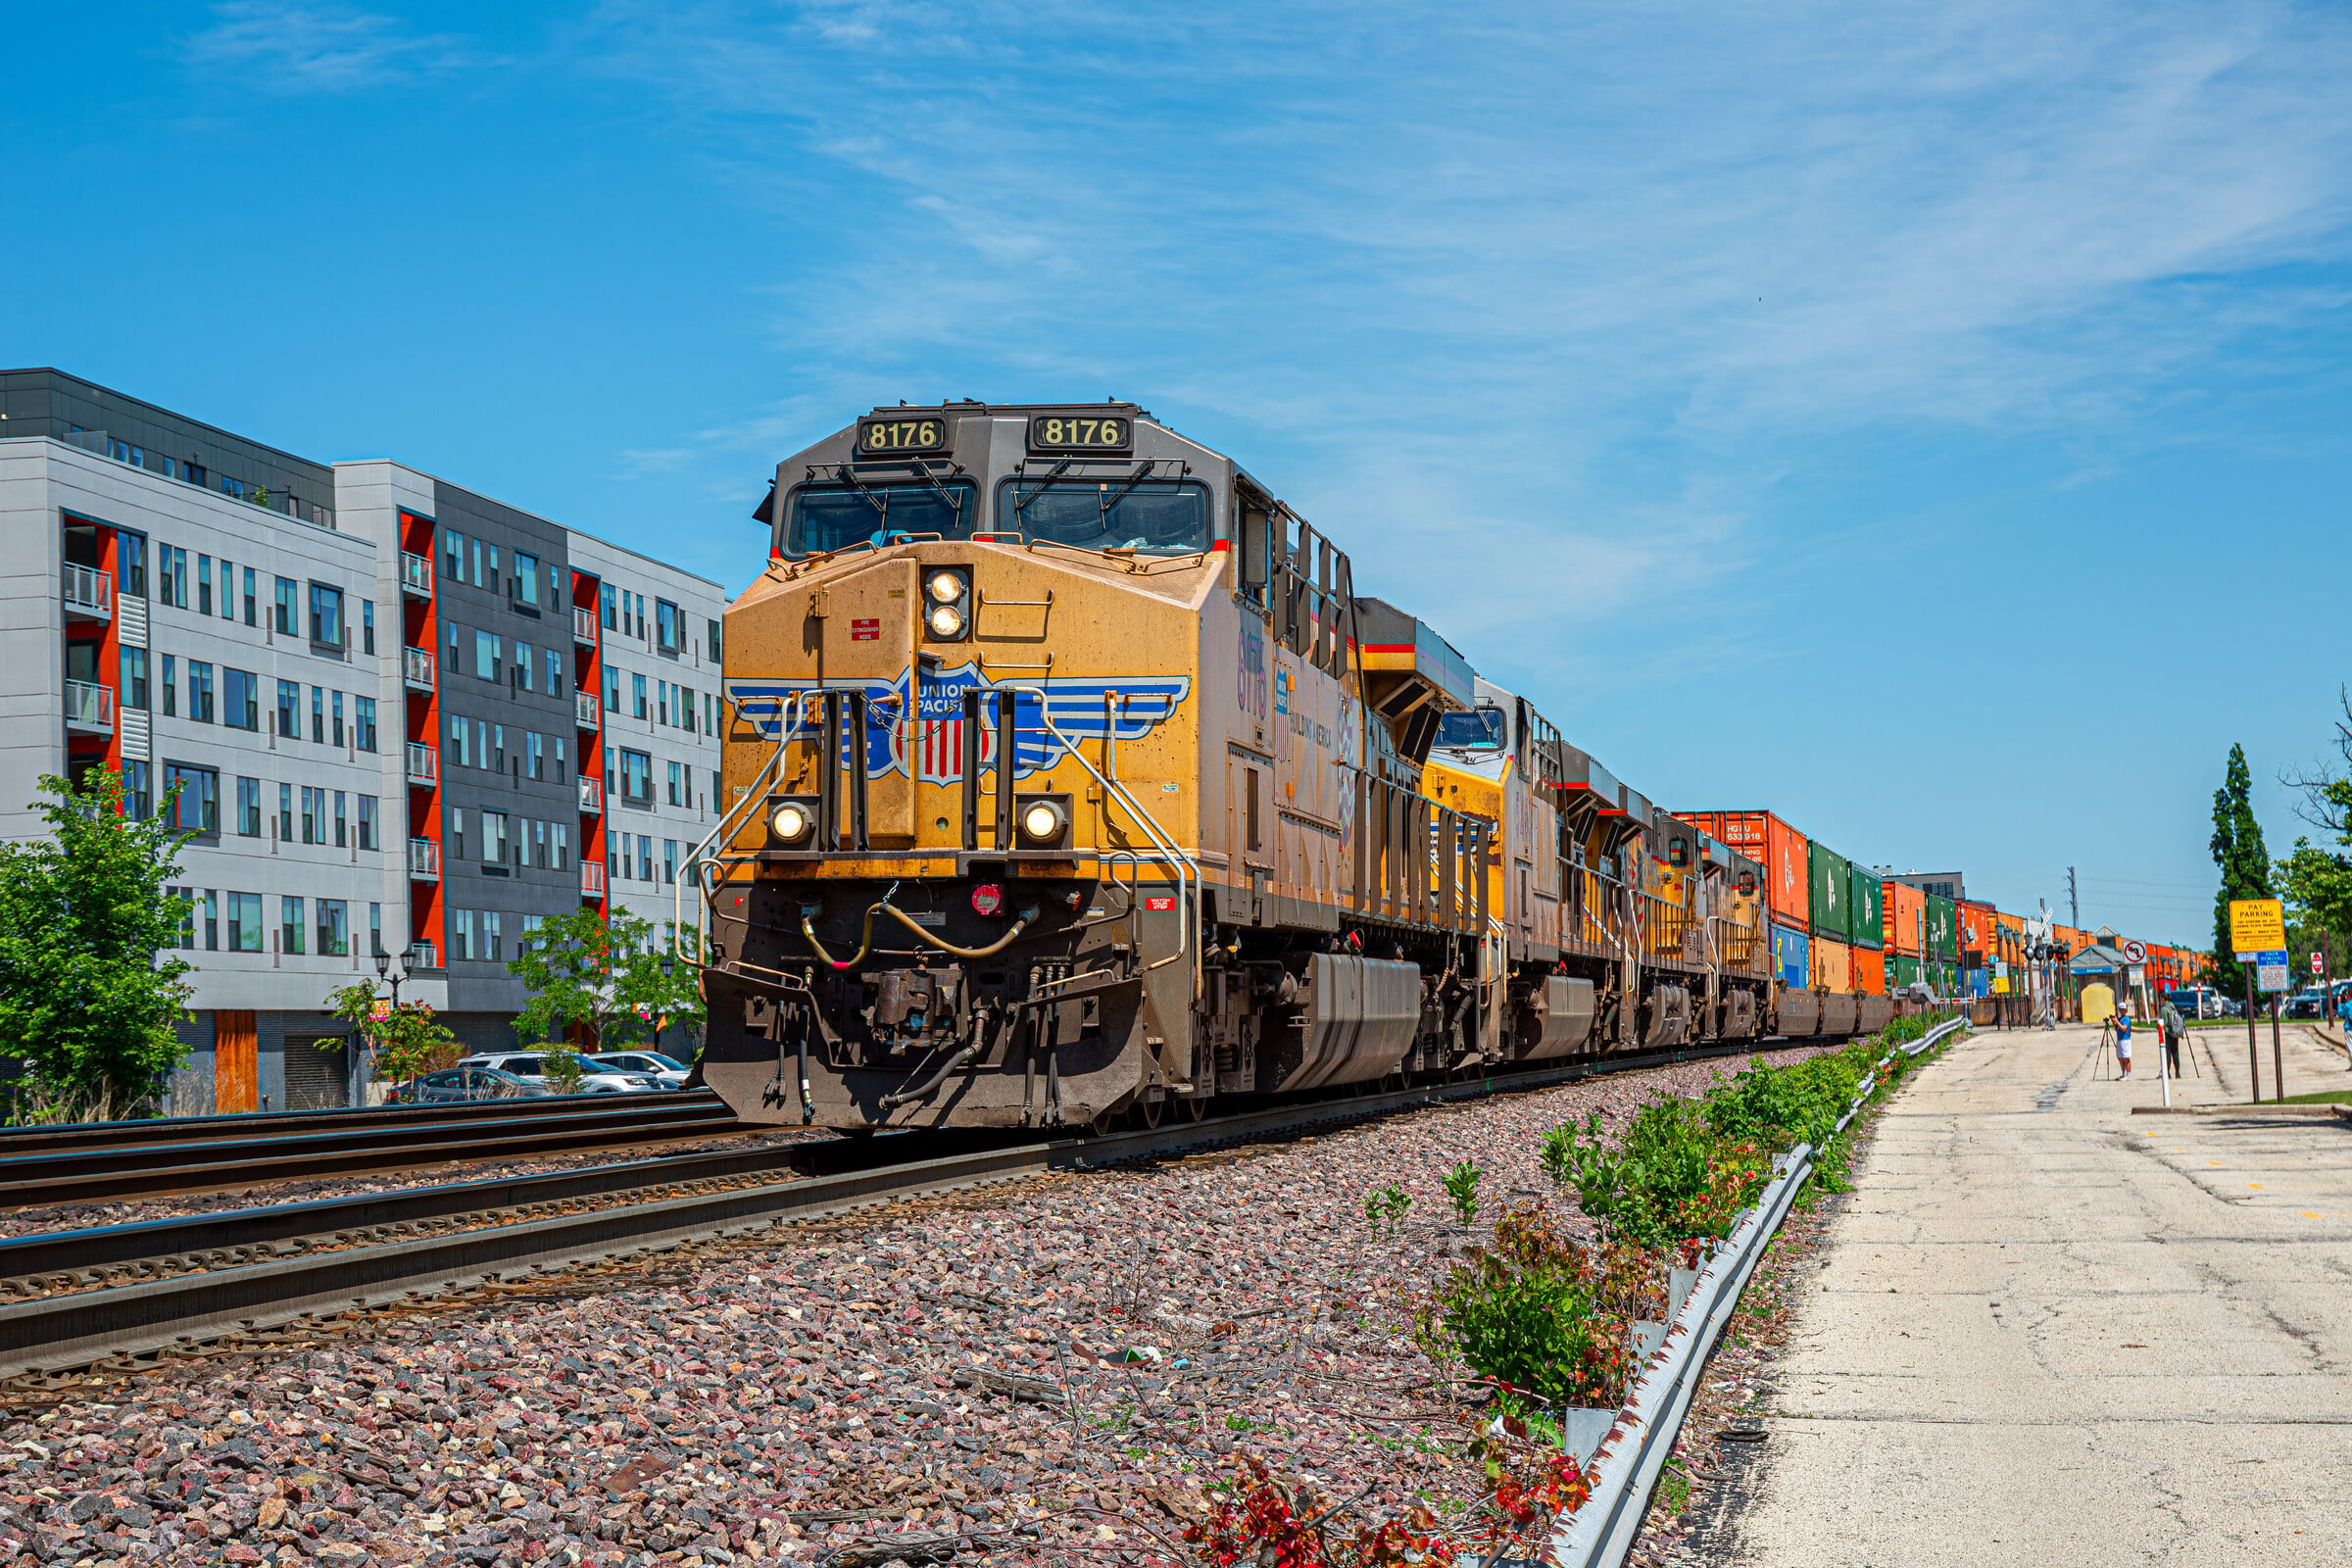
Photo: Union Pacific freight train in Elmhurst, Illinois, May 25, 2025. Archival photograph by GP FullFrame, via Wikimedia Commons; public domain.


Leave a Reply