
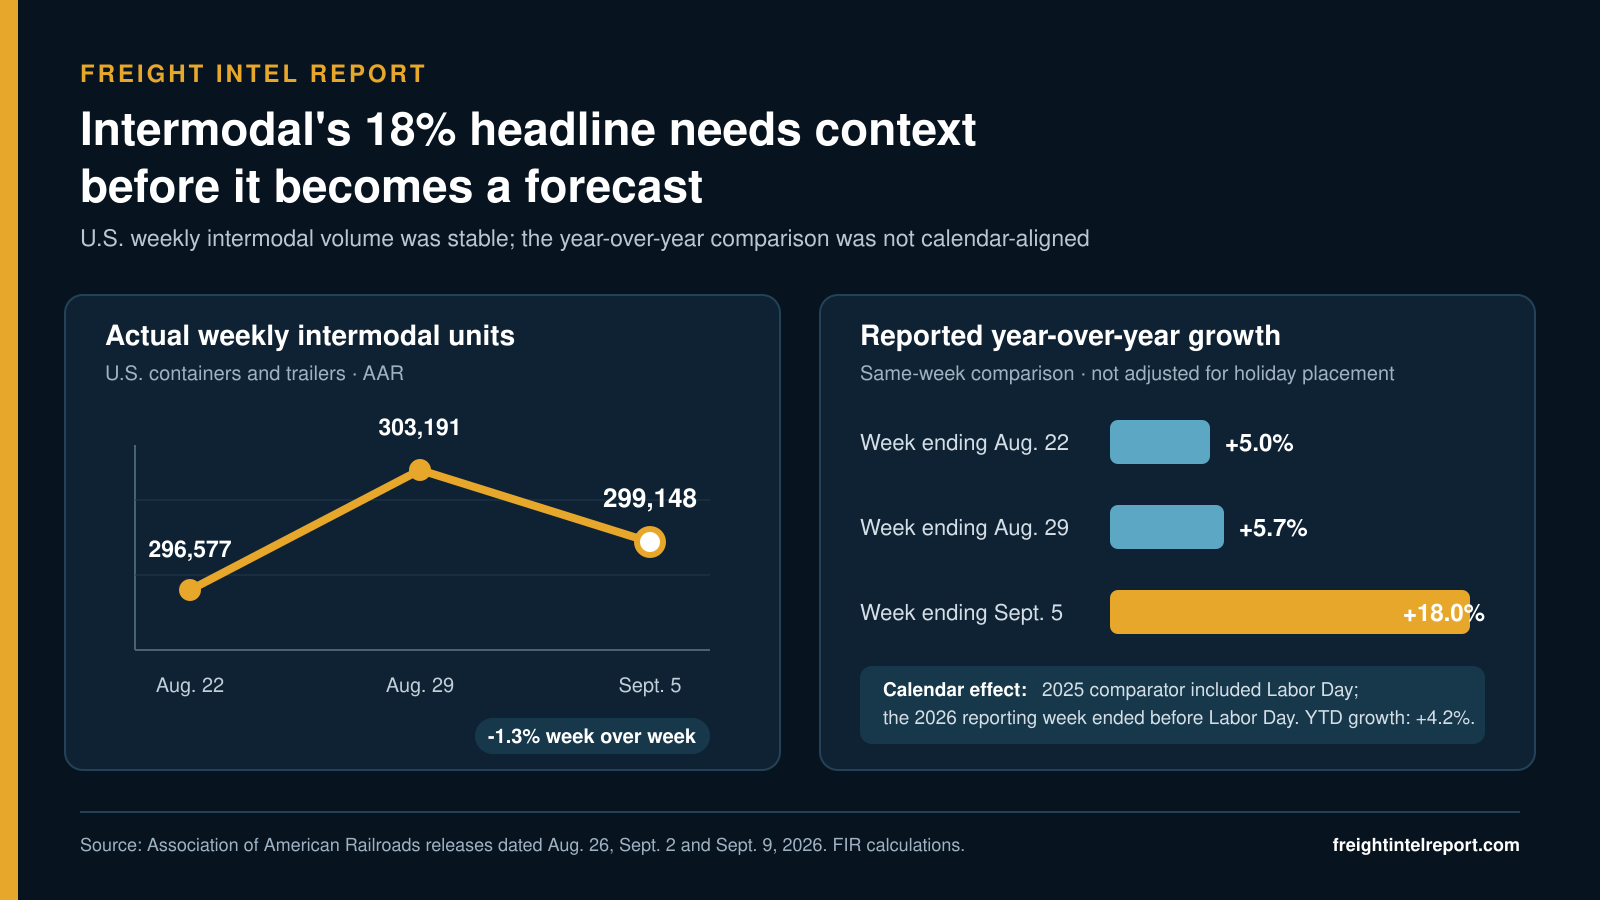
AAR’s latest comparison is accurate but calendar-distorted. Actual intermodal volume fell 1.3% from the prior week, while year-to-date growth reached 4.2%. Shippers should separate the headline from the planning signal.
Chart: U.S. intermodal volume was nearly flat across the latest three weeks. The 18% year-over-year headline compares a full pre-holiday 2026 week with a 2025 week that included Labor Day. Source: AAR; FIR calculations.
The latest U.S. rail report contains a number large enough to reshape a transportation forecast—and a calendar mismatch large enough to make that forecast wrong.
The Association of American Railroads reported September 9 that U.S. intermodal volume reached 299,148 containers and trailers for the week ending September 5, up 18.0% from the comparable week in 2025. Total U.S. weekly rail traffic rose 13.8%, while carloads increased 8.9%.
Those are the published comparisons. But they do not describe an 18% week-over-week demand surge.
Actual intermodal units fell from 303,191 in the week ending August 29 to 299,148 in the week ending September 5—a 1.3% decline. The latest reading was also just 0.2% below the three-week average of 299,639 units.
The apparent contradiction is explained partly by the calendar. Labor Day fell on September 1 in 2025, inside AAR’s comparison week ending September 6. In 2026, Labor Day fell on September 7, after the latest reporting week ended. One side of the year-over-year comparison includes a holiday that reduced normal operating days; the other does not.
The 18% calculation is not erroneous. Treating it as a clean demand-growth rate would be.
The underlying intermodal signal is positive—but much smaller
AAR’s surrounding data provide a better view of direction.
U.S. intermodal volume increased 5.0% year over year for the week ending August 22 and 5.7% for the week ending August 29. Through the first 35 weeks of 2026, railroads handled 9.90 million intermodal units, 4.2% more than at the same point in 2025.
That year-to-date gain matters. It indicates that intermodal is growing even after smoothing away the holiday effect. But it supports a moderate-growth interpretation, not an 18% step-change in underlying demand.
The broader freight system reinforces that caution. The Bureau of Transportation Statistics reported September 9 that its Freight Transportation Services Index fell 0.7% in July from June and 2.0% from July 2025. BTS said July declines in air freight, pipeline and trucking outweighed increases in rail carloads, rail intermodal and water volumes.
The two releases cover different periods and universes. They should not be forced into a single composite. Together they describe a split market: rail intermodal can gain share or volume while total for-hire freight activity remains soft.
That is more useful for shippers than either a boom narrative or a recession narrative.
Why the holiday distortion matters in a Q4 bid
A weekly percentage can migrate quickly from an industry report into a carrier presentation, procurement dashboard or executive forecast. Once the number is described as “intermodal demand up 18%,” it can influence three decisions that deserve better evidence.
First, it can create false capacity urgency. A shipper may interpret the increase as proof that rail capacity is suddenly tightening everywhere and accept a shorter quote validity period, higher peak surcharge or earlier commitment than the lane actually requires.
Second, it can distort modal-conversion assumptions. With national diesel at $5.967 per gallon and truck-freight producer prices up 14.3% year over year in August, intermodal deserves renewed screening. But the decision should depend on door-to-door economics, service reliability and inventory exposure—not an unadjusted holiday comparison.
Third, it can contaminate a volume forecast. Applying 18% growth to planned loads, chassis requirements, drayage appointments or warehouse labor would convert a calendar artifact into an operating plan.
The better planning signal is layered:
- Immediate volume: 299,148 units, down 1.3% from the prior week and essentially in line with the latest three-week average.
- Near-term direction: the two preceding weekly year-over-year gains were 5.0% and 5.7%.
- Structural direction: year-to-date intermodal volume is up 4.2%.
- Broader demand: the July Freight TSI was down 2.0% year over year, even though rail intermodal increased within the index.
Five controls shippers should use before acting on the spike
1. Align the calendar before comparing demand
Flag weeks containing Labor Day, Memorial Day, Independence Day, Thanksgiving and Christmas. Compare like operating periods or use rolling averages. A year-over-year percentage based on different holiday placement should be labeled before it reaches an executive dashboard.
2. Separate volume growth from capacity tightness
Network-wide units do not establish lane-specific availability. Check origin ramp cutoffs, destination availability, train schedules, chassis supply, free time, drayage coverage and recovery options. A national gain can coexist with excess capacity in one corridor and operational stress in another.
3. Test total landed cost—not rail linehaul alone
The truck-versus-intermodal screen should include origin and destination drayage, fuel, rail linehaul, lifts, chassis, storage, accessorials, inventory carrying cost and the financial consequence of a missed delivery window. Higher diesel improves the case for reviewing long-haul conversions, but it does not make every intermodal move cheaper.
4. Put evidence thresholds into bid governance
Do not permit a peak surcharge, capacity reservation or mode shift to rely on one national weekly percentage. Require at least a rolling volume measure, a lane-specific service indicator and a documented cost comparison. Define what evidence will trigger an allocation change and what evidence will reverse it.
5. Watch the post-holiday report
The next AAR release will compare a 2026 week that includes Labor Day with a 2025 week after the holiday. That comparison may swing in the opposite direction. The useful question is not whether the percentage rises or falls, but whether absolute volume, rolling averages and year-to-date growth continue to support the same capacity conclusion.
A stronger reading of the rail data
The latest report should not be dismissed. Intermodal’s 4.2% year-to-date gain is stronger than the broader Freight TSI, and the prior two weekly comparisons were positive even without the same obvious holiday mismatch. That supports continued shipper interest in intermodal—especially where high truck fuel exposure, long length of haul and predictable demand make conversion feasible.
Carloads also show real breadth. Nine of ten commodity groups increased year over year in the latest week, led in absolute gains by metallic ores and metals, grain and chemicals. Yet carloads are up 2.8% year to date, far below the holiday-week increase of 8.9%.
In other words, the same discipline applies across the report: the weekly holiday comparison is a noisy accelerant on top of a genuinely positive but more moderate rail trend.
Freight Intel Report assessment
The most consequential fact in AAR’s latest release is not that intermodal “grew 18%.” It is that the freight market can produce an accurate headline that becomes misleading when removed from its operating calendar.
Shippers should keep the durable signal and discard the exaggeration. Intermodal is growing. Its year-to-date gain is meaningful. High diesel and a widening truck-versus-rail price gap justify lane-level conversion work.
But the latest absolute volume did not surge. It declined from the prior week and remained near the recent average. That is not evidence of an immediate national capacity shock.
Before Q4 bids are locked, transportation teams should correct the calendar, test the lane and document the total cost. The advantage belongs to the shipper who knows which number describes demand—and which number describes the date on which the holiday fell.
Freight Intel Report provides independent informational analysis. This article is not legal, financial, regulatory, compliance, operational or business advice and does not recommend a carrier, rate, route or transaction. Verify shipment facts, contract terms, service requirements and source data independently.
Sources
- Association of American Railroads, “AAR Reports Weekly Rail Traffic for the Week Ending September 5, 2026,” released September 9, 2026: Read source
- Association of American Railroads, week ending August 29, released September 2, 2026: Read source
- Association of American Railroads, week ending August 22, released August 26, 2026: Read source
- Bureau of Transportation Statistics, July 2026 Freight Transportation Services Index, released September 9, 2026: Read source
- U.S. Energy Information Administration, Gasoline and Diesel Fuel Update, released September 9, 2026: Read source
Related FIR analysis
- Diesel and truck-freight prices: the Q4 bid audit
- The truck-to-intermodal conversion window
- September Freight Outlook
- FIR Multimodal Rate Monitor
Government services: For government services, verification, registrations, forms, reporting, or instructions, always navigate to the official agency website directly. Independently verify its address before entering credentials or business information.
Leave a Reply