
A grain shipper can pay more to secure a year of rail capacity even while the price of near-term access falls. That is the distinction inside USDA’s latest transportation report—and it matters more for a 2027 commitment than a headline about record exports.
BNSF’s September 23 auction sold 13 yearlong shuttle-train contracts beginning in January 2027 for $17.2 million. USDA reports average winning bids of about $1.3 million, compared with $595,000 for the prior January-start auction. Yet average September secondary shuttle bids and offers fell $67 in a week to $525 per car above tariff.
These are different products, units and delivery periods. The weekly decline does not make the annual contracts cheap or expensive. The annual auction does not establish that today’s capacity is tightening everywhere.
The question for exporters is how much usable freight a forward commitment will support—and what happens to its economics if train cycles slow or sales disappoint.
Three facts to keep on separate dates
USDA’s September 24 Grain Transportation Report establishes the context:
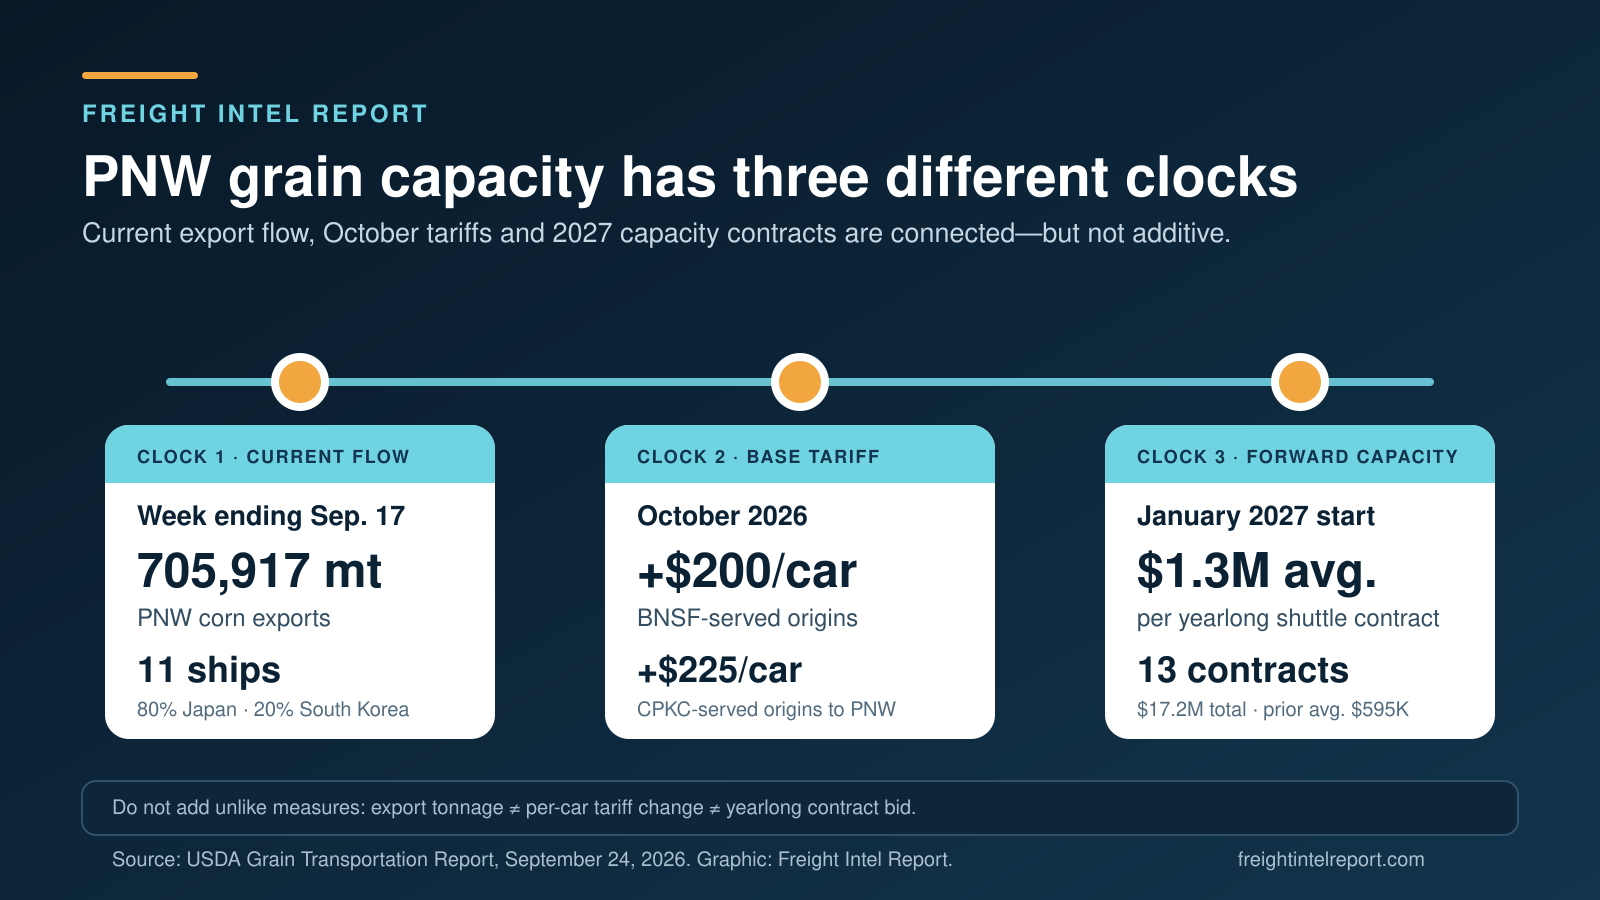
- September flow: PNW terminals inspected 705,917 metric tons of corn for export on 11 ships in the week ending September 17. USDA calls it a record for the comparable week, not the largest week ever. It ranked third among 2026 weeks so far; 80% was destined for Japan and 20% for South Korea.
- October tariffs: Covered western Corn Belt-to-PNW rail tariffs will rise $200 per car at BNSF-served origins and $225 at CPKC-served origins. These are lane-specific tariff changes, not increases to every grain shipment’s total bill.
- January 2027 capacity: The auction bids cover yearlong shuttle contracts. The roughly $1.3 million average is not a price per car, per train trip or per ton.
Original FIR visual. Source: USDA Grain Transportation Report, September 24, 2026. Export tonnage, tariff changes and yearlong contract bids are different measures; they cannot be added together.
A strong export week is evidence of throughput, not proof of congestion
The PNW export figure shows substantial corn moving through the gateway. It does not show that terminals missed vessel windows, that trains were delayed or that the system exhausted its capacity. Strong throughput can reflect successful execution as well as strong demand.
USDA also reports 28,001 U.S. Class I grain carloads for the week ending September 12, up 16% year over year and 30% from the prior three-year average. That is a national grain measure for an earlier week—not a count of cars supplying those 11 PNW ships.
For an exporter, the useful follow-up is specific: can origin loading, train turns, terminal intake and vessel nominations support the sales program being committed? Japan and South Korea’s destination shares do not reveal individual buyers, terminal congestion or how many commercial programs were involved.
FIR’s September 15 rail fuel and harvest analysis addressed surcharge exposure and equipment pressure. This new auction raises a different decision: whether a fixed forward-capacity commitment can be used often enough to justify its cost.
The missing denominator is usable carloads
To examine a capacity bid, divide its cost by the loaded car movements the contract can actually support over its term. A car making several loaded trips contributes several movements; counting the physical fleet only once would use the wrong denominator.
The following is an illustrative allocation of a $1.3 million bid, using USDA’s rounded average. It does not describe BNSF’s required train size, permitted turns, payment schedule or guaranteed performance.
| Illustrative loaded car movements over the term | Allocated bid cost per loaded movement |
|---|---|
| 2,000 | $650 |
| 3,000 | about $433 |
| 4,000 | $325 |
This is the bid component alone, not an all-in transportation quote. Applicable linehaul, fuel, equipment, terminal and other charges must be established from the actual agreement; incentives or credits must be included according to their terms.
The denominator can change even when the bid does not. If a program planned for 4,000 loaded movements delivers only 3,000, the allocated bid cost rises from $325 to about $433 per movement—one-third higher because utilization fell 25%.
That arithmetic is why cycle time belongs in the commercial review. A sales forecast may support the volume on paper while loading delays, terminal constraints or longer round trips prevent the equipment from moving it. The reverse also matters: fast cycles do not create profitable freight if customers no longer need the planned volume.
Compare the commitment with a workable alternative
The relevant alternative is the cost and service outcome available to the same freight without the annual commitment. It is not automatically today’s $525 secondary-market average.
That reported average concerns September bids and offers above tariff in the week ending September 17. It is neither a January 2027 forward quote nor a guarantee of capacity at a particular origin. Applying it to every car in a future annual program would manufacture a comparison the evidence cannot support.
A useful evaluation holds origin, destination, timing and service requirements constant. It then tests committed volume, achievable turns, incremental charges, applicable incentives, and the realistic alternative if the capacity right is not held.
Potential service protection may have value, but it needs evidence too. Avoided storage, missed-vessel expense or replacement freight should be modeled as scenarios with stated probabilities and costs—not booked as certain savings. Contract remedies, cancellation rights and transferability should be verified rather than assumed.
The September auction is already complete. Its result is a benchmark for reviewing existing commitments or future offers, not an invitation to enter a sale that remains open.
October’s increase belongs in a separate calculation
For a purely illustrative 110-car movement entirely subject to the reported increase, $200 per car adds $22,000 to the tariff component; $225 adds $24,750. Actual applicability depends on the railroad, covered origin, destination and governing terms.
Those calculations say nothing about a capacity bid, fuel surcharge or total delivered cost. They also do not establish that BNSF is cheaper than CPKC: starting tariffs, routes, services and other charges differ.
Keep the tariff change in the shipment budget and the annual bid allocation in the forward-capacity case. Where a commercial quote already bundles either item, identify it before adding another allowance. Use the FIR Multimodal Rate Monitor for dated market context, then obtain the terms governing the actual movement.
A cheaper contract can be the wrong product
USDA reports that BNSF separately sold three four-month Direct Domestic Efficiency Train contracts starting in March 2027, with winning bids averaging just over $100,000.
That is not a like-for-like alternative to a yearlong shuttle commitment. USDA specifies that Direct DETs cannot unload at PNW export terminals, have shorter terms and lack the shuttle loading/unloading incentives.
An apparently attractive capacity price offers no protection for a PNW export program if the product cannot serve its terminal. Check destination eligibility before comparing the headline bid. Then confirm term, equipment obligations, performance provisions and all charges outside the bid.
What the next commitment should demonstrate
Before treating a forward-capacity proposal as protection, its business case should answer four questions:
- Which freight will use it? Separate customer commitments from speculative volume and match eligible origins and terminals to the contract.
- How many loaded movements are achievable? Use observed cycle performance and test a slower-turn case alongside weaker demand.
- What is the actual alternative? Compare executable or clearly labeled scenario costs for the same freight; do not substitute an unrelated weekly market average.
- Who bears the downside? Identify unused-capacity exposure, missed-window costs, remedies and the person authorized to change the plan.
USDA’s new figures support a sharper conclusion than “grain freight is getting more expensive.” Current exports are strong, covered October tariffs are rising, near-term shuttle premiums have eased, and bidders paid substantially more for a different, yearlong product.
Paying for access and making productive use of it are separate achievements. The stronger 2027 procurement plan proves both.
Sources and calculation notes
USDA Agricultural Marketing Service, Grain Transportation Report, September 24, 2026, pages 2–3: PNW inspections, October tariff changes, shuttle and Direct DET auction results, national grain carloads and secondary-market values. USDA reports $17.2 million across 13 contracts; the implied $1.323 million mean is consistent with its rounded $1.3 million headline. FIR uses that rounded figure for the explicitly hypothetical utilization examples. No bidder-level profitability or contract performance is established by the report.
The analysis and scenarios are FIR’s; they are not USDA forecasts or individualized procurement recommendations. For government services, registrations, verification, forms or reporting, navigate directly to the official agency website and independently verify its address.
Leave a Reply